Figure 1. Virologic Response Through Week 48, Epv20001a,b (intent-to-treat) (Lamivudine Figure1)
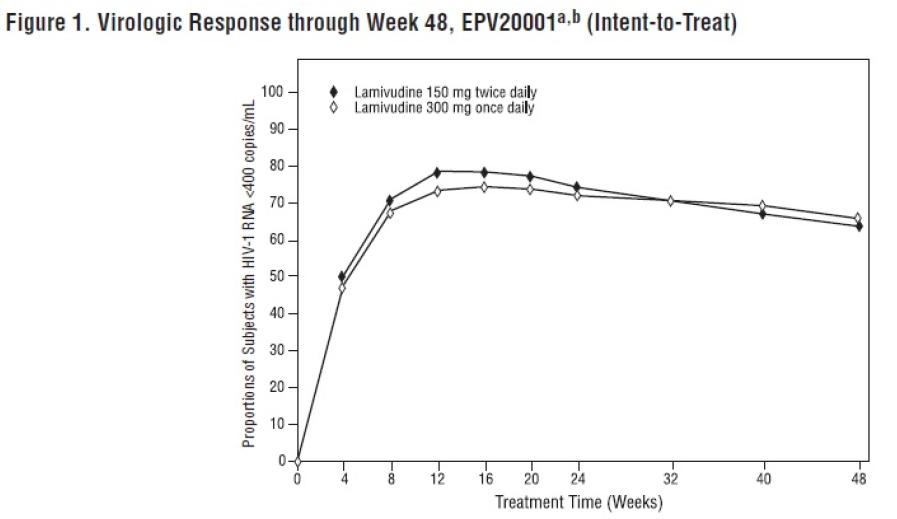
The image shows a graph titled "Figure 1. Virologic Response through Week 48, EPV200012.(Intent-to-Treat)" with two lines labeled "Lamivudine 150 mg twice daily" and "Lamivudine 300 mg once daily". The x-axis shows the treatment time in weeks ranging from 0 to 48, while the y-axis shows the proportion of subjects with HIV-1 RNA <400 copies/mL. The graph indicates that the group given Lamivudine 150 mg twice daily had a higher proportion of subjects with HIV-1 RNA <400 copies/mL over the 48 weeks.*