Figure (Tremfya 01)
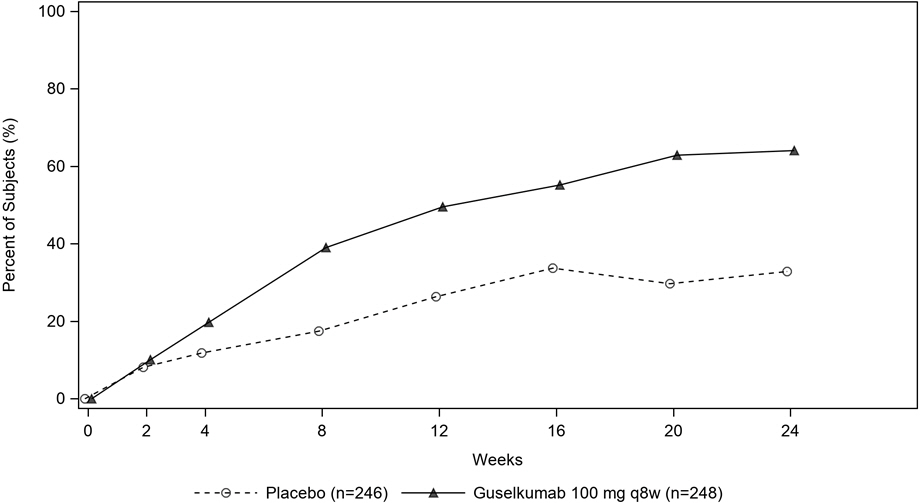
The text above shows a graph with the percentages of subjects in a clinical trial over time. The trial compared a placebo treatment with Guselkumab administered every 8 weeks at a dose of 100mg. The X-axis of the graph represents the weeks of the trial, while the Y-axis depicts the percentage of subjects in each treatment group.*