Imaavy Injection, Solution, Concentrate
Product Images NDC 57894-800

View Photos of Packaging, Regulatory Labels, and Product Appearance

Product Visual Gallery

This gallery contains 4 technical images submitted to the FDA as part of the official labeling for Imaavy (NDC 57894-800). Unlike standard consumer photos, these assets often include clinical data figures, molecular chemical structures, and official manufacturer packaging layouts.

As provided by Janssen Biotech, Inc., these visuals offer a comprehensive scientific overview of the product's physical and chemical identity, aiding pharmacists and researchers in product verification and study.

FDA Label Image

1200mg (1200 mg Box)

1200mg (1200 mg Box)
The image shows a carton label for IMAAVY (nipocalimab-aahu) injection, 1,200 mg/6.5 mL (185 mg/mL), concentrated solution for intravenous infusion after dilution. The label states it is a single-dose vial, manufactured by Janssen Biotech, Inc., USA, with storage instructions at 2°C to 8°C. It includes dosage components, handling instructions, and barcodes, featuring the Johnson & Johnson logo.*
FDA Label Image

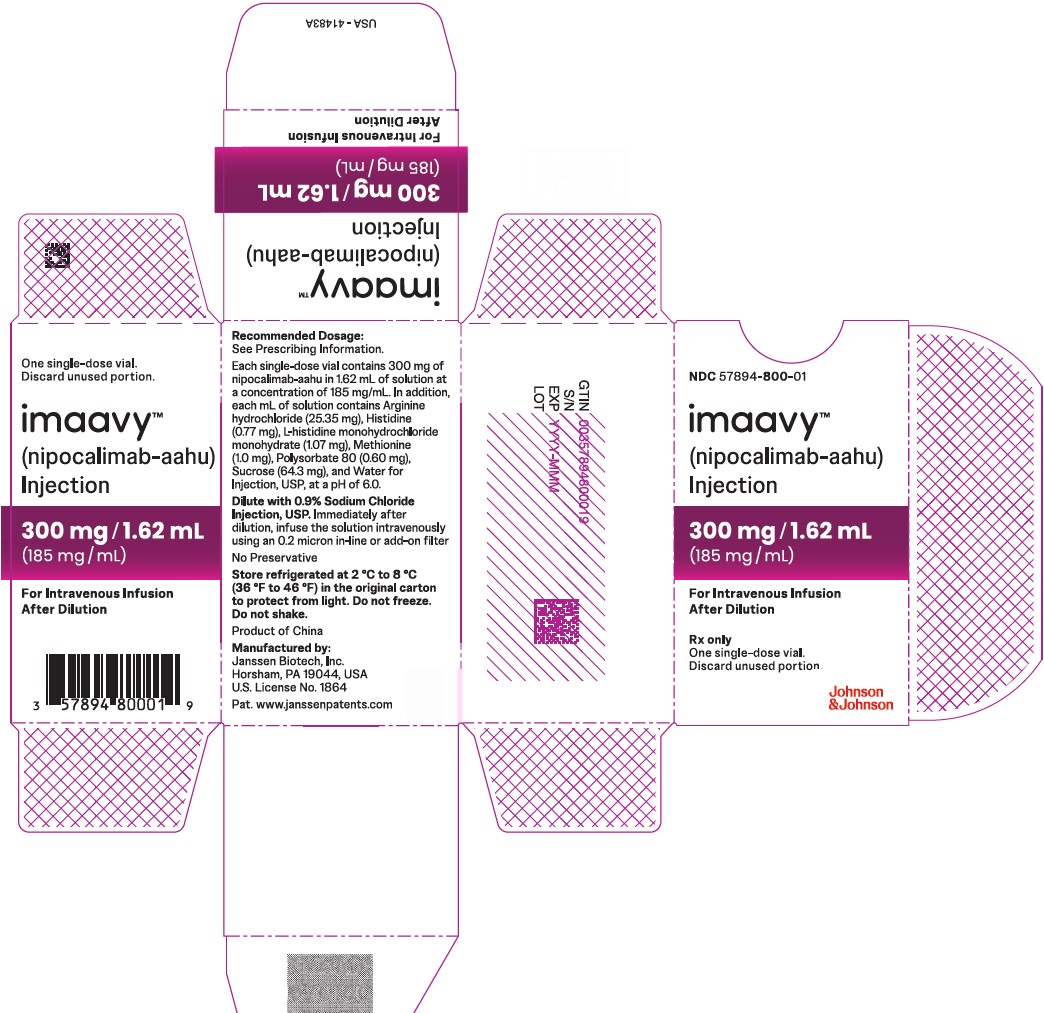
300mg (300mg Box)

300mg (300mg Box)
This is the packaging label for IMAAVY (nipocalimab-aahu) injection, concentrate for intravenous infusion. The label shows a strength of 300 mg per 1.62 mL (185 mg/mL) in a single-dose vial. It is manufactured by Janssen Biotech, Inc. and distributed by Johnson & Johnson. The label includes storage instructions, dilution requirements, and dosage information.*
FDA Label Image

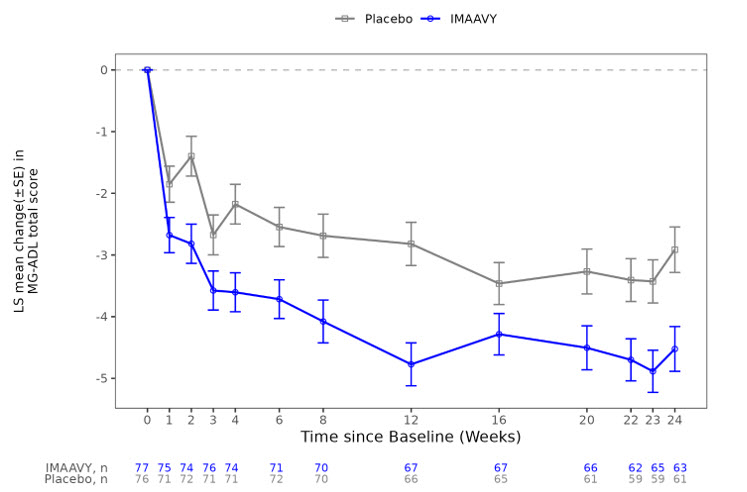
Figure 1 (Imaavy 01)

Figure 1 (Imaavy 01)
Line graph comparing LS mean change (±SE) in MG-ADL total score over 24 weeks for IMAAVY (nipocalimab-aahu) injection versus placebo. The vertical axis shows change in score, and the horizontal axis shows time in weeks since baseline. The IMAAVY group shows a greater decrease in score compared to placebo throughout the study, with sample sizes indicated at various time points for both groups.*
FDA Label Image

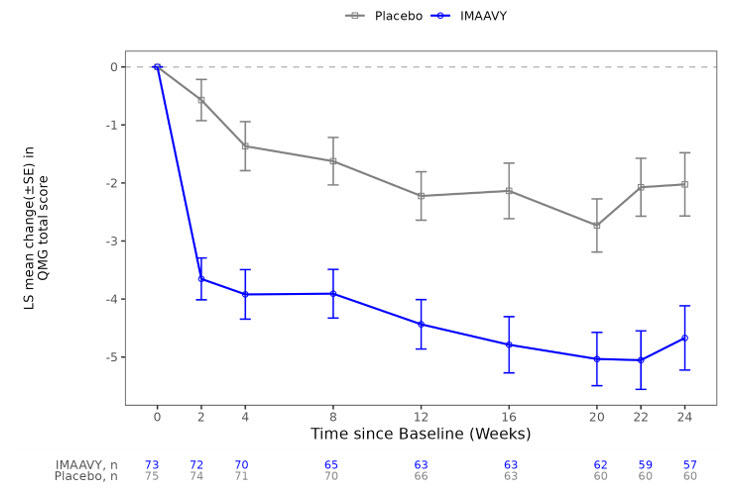
Figure 2 (Imaavy 02)

Figure 2 (Imaavy 02)
A line graph comparing the least squares mean change in QMG total score over 24 weeks between IMAAVY (nipocalimab-aahu) and placebo groups. The x-axis represents time since baseline in weeks, while the y-axis shows LS mean change with standard error. IMAAVY shows a larger decrease in QMG score versus placebo throughout the study period.*

* About these descriptions: Image descriptions on this page are generated by automated AI analysis of the product label images from the manufacturer's FDA label submission (SPL). They are provided for reference only and may contain errors or omissions. Always rely on the printed label itself and the official FDA labeling, and consult a pharmacist or healthcare professional with any questions about this product.