Product Images Tamsulosin Hydrochloride

View Photos of Packaging, Labels & Appearance

Product Label Images

The following 7 images provide visual information about the product associated with Tamsulosin Hydrochloride NDC 58118-0598 by Clinical Solutions Wholesale, Llc, such as packaging, labeling, and the appearance of the drug itself. This resource could be helpful for medical professionals, pharmacists, and patients seeking to verify medication information and ensure they have the correct product.

tamsulosin 0.4mg

tamsulosin 0.4mg

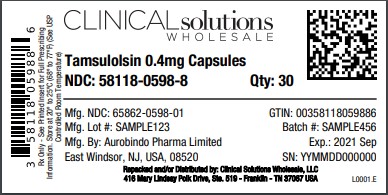
This is an advertisement for Tamsulosin 0.4mg capsules sold at a wholesale price by Clinical Solutions. It includes details such as the National Drug Code (NDC) and quantity being sold (30 capsules), and the manufacturer's NDC and lot/batch number. The manufacturer is identified as "Aucbiio Phrma Lined" and the product is set to expire in 2021. There is also a mention of a location in California, USA.*

Figure 1 Mean Plasma Tamsulosin Hydrochloride Concentrations Following Single-Dose Administration of Tamsulosin Hydrochloride Capsules 0.4 mg Under Fasted and Fed Conditions (n=8) - tamsulosin fig1

Figure 1 Mean Plasma Tamsulosin Hydrochloride Concentrations Following Single-Dose Administration of Tamsulosin Hydrochloride Capsules 0.4 mg Under Fasted and Fed Conditions (n=8) - tamsulosin fig1

This appears to be a figure or graph depicting the mean plasma concentrations of Tamsulosin Hydrochloride capsules 0.4 mg under fasted and fed conditions. There is a time axis in hours and two lines indicating the concentrations under each condition. No further interpretation can be made without the graph itself.*

Figure 2A Mean Change from Baseline in Total AUA Symptom Score (0 to 35) Study 1 - tamsulosin fig2

Figure 2A Mean Change from Baseline in Total AUA Symptom Score (0 to 35) Study 1 - tamsulosin fig2

Figure 2B Mean Change from Baseline in Total AUA Symptom Score (0 to 35) Study 2 - tamsulosin fig3

Figure 2B Mean Change from Baseline in Total AUA Symptom Score (0 to 35) Study 2 - tamsulosin fig3

The image shows the mean change from baseline in total AUA symptom score (ranging from 0 to 35) in Study 2 for the treatments of 0.08mg LNT, 0.4mg LNT, and placebo. The duration of treatment in weeks is indicated on the bottom axis. The data is displayed in a bar graph format.*

Figure 3A Mean Increase in Peak Urine Flow Rate (mL/Sec) Study 1 - tamsulosin fig4

Figure 3A Mean Increase in Peak Urine Flow Rate (mL/Sec) Study 1 - tamsulosin fig4

The figure shows the mean increase in peak urine flow rate in L/sec for Study 1. The treatment group received either 0.08mg or 0.4mg, while the control group received a placebo. The duration of treatment was measured in weeks, and the study had a total sample size of 635, 621, 617, 754, 755, 752, 713, and 694, respectively.*

Figure 3B Mean Increase in Peak Urine Flow Rate (mL/Sec) Study 2 - tamsulosin fig5

Figure 3B Mean Increase in Peak Urine Flow Rate (mL/Sec) Study 2 - tamsulosin fig5

This text is describing a figure labeled Figure 3B which shows the mean increase in peak urine flow rate in mL/Sec for Study 2. The figure has a chart with different treatment options along the horizontal axis and the mean increase in peak urine flow rate on the vertical axis. The chart shows that the treatment option with the highest mean increase in peak urine flow rate is located around 20. The text also includes a legend for the chart which includes a symbol and abbreviation key. The duration of the treatment is also shown on the horizontal axis in weeks.*

Chemical Structure - tamsulosin str

Chemical Structure - tamsulosin str

* The product label images have been analyzed using a combination of traditional computing and machine learning techniques. It should be noted that the descriptions provided may not be entirely accurate as they are experimental in nature. Use the information in this page at your own discretion and risk.