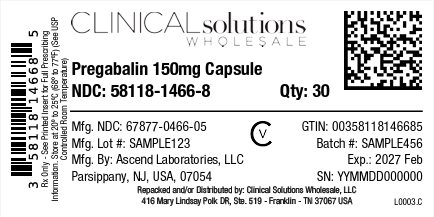
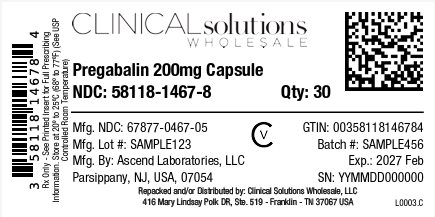
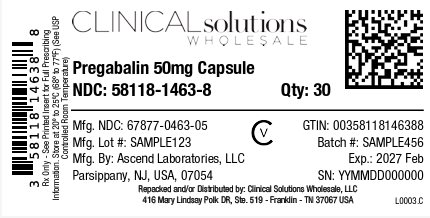
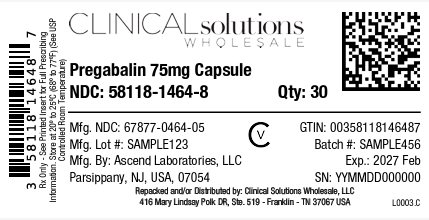
Pregabalin 100mg Capsule 30ct Blister Card (Prega 100mg 90s A)
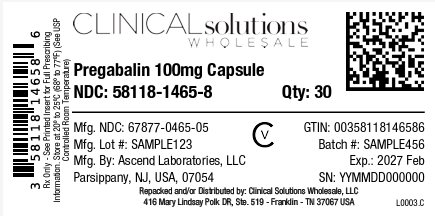
This is a description of a medication package containing Pregabalin 100mg capsules. The package details include NDC numbers, quantity, manufacturer information (Ascend Laboratories, LLC), expiration date (2027 Feb), batch number (SAMPLE123), and location of the manufacturer (Parsippany, NJ, USA). The text also includes references to clinical solutions and the distributor (CiriclSutor W LG).*