Sevoflurane
Product Images NDC 58181-5200

View Photos of Packaging, Regulatory Labels, and Product Appearance

Product Visual Gallery

This gallery contains 14 technical images submitted to the FDA as part of the official labeling for Sevoflurane (NDC 58181-5200). Unlike standard consumer photos, these assets often include clinical data figures, molecular chemical structures, and official manufacturer packaging layouts.

As provided by Nextsource Pharma, these visuals offer a comprehensive scientific overview of the product's physical and chemical identity, aiding pharmacists and researchers in product verification and study.

FDA Label Image

Sevoflurane-box (Sevoflurane Box)

Sevoflurane-box (Sevoflurane Box)
Packaging label for Sevoflurane USP 250 mL inhalation anesthetic by NextSource Pharma. The label includes the NDC 58181-5200-1, storage instructions, and manufacturer information. The design features prominent yellow panels with the product name and volume, and the NextSource Pharma logo at the bottom.*
FDA Label Image

Sevoflurane-container (Sevoflurane Container)

Sevoflurane-container (Sevoflurane Container)
Label for Sevoflurane USP 250 mL inhalation anesthetic by NextSource Pharma. The label includes the NDC 58181-5200-1, manufacturer information, storage instructions, and a barcode. It states the product is for Rx use only and specifies the volume as 250 mL.*
FDA Label Image

Fig-1 (Sevoflurane Fig 1)

Fig-1 (Sevoflurane Fig 1)
A line graph depicting the relationship between fresh gas flow rate (L/min) on the x-axis and compound A concentration in parts per million (ppm) on the y-axis for Sevoflurane. The graph shows a decreasing trend in compound A concentration as the fresh gas flow rate increases from 0.5 to 3 L/min, with a slight increase at 4 L/min.*
FDA Label Image

Fig-10 (Sevoflurane Fig 10)

Fig-10 (Sevoflurane Fig 10)
A line graph comparing Sevoflurane with oxygen versus Sevoflurane with oxygen/nitrous oxide, plotting flow rate (L/min/m²) against MAC level. The chart includes baseline and MAC levels from 1.0 to 2.0, with error bars indicating variability.*
FDA Label Image

Fig-2 (Sevoflurane Fig 2)

Fig-2 (Sevoflurane Fig 2)
A line graph depicting the relationship between carbon dioxide flow (mL/min) on the x-axis and compound A concentration (ppm) and maximum temperature (°C) on the y-axis. Compound A (ppm) is represented by a line with circular markers, and maximum temperature (°C) is represented by a line with square markers, both showing an increasing trend as carbon dioxide flow increases. The graph includes a legend labeling the two data series.*
FDA Label Image

Fig-2a (Sevoflurane Fig 2a)

Fig-2a (Sevoflurane Fig 2a)
A scatter plot graph depicting the relationship between sevoflurane exposure (MAC-Hour) on the x-axis and Inspired Compound AAUC (ppm-hr) on the y-axis. The graph includes a trend line with a correlation coefficient (r) of 0.96 and a significance level (p) less than 0.001, indicating a strong positive correlation.*
FDA Label Image

Fig-3 (Sevoflurane Fig 3)

Fig-3 (Sevoflurane Fig 3)
A line graph showing the fraction of anesthetic concentration in the alveoli (F A/F I) over 40 minutes of administration. The graph compares five anesthetics: Halothane, Isoflurane, Sevoflurane, Desflurane, and N2O, with distinct markers for each drug. The horizontal axis represents time in minutes, and the vertical axis shows the fraction from 0.2 to 1.*
FDA Label Image

Fig-4 (Sevoflurane Fig 4)

Fig-4 (Sevoflurane Fig 4)
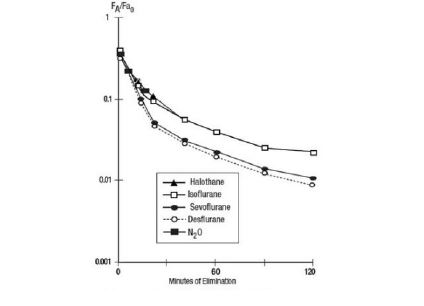
A semi-logarithmic line chart comparing the elimination rates of five anesthetic agents: Halothane, Isoflurane, Sevoflurane, Desflurane, and Nitrous Oxide (N2O). The x-axis represents minutes of elimination (0 to 120), and the y-axis shows the ratio of alveolar concentration to initial concentration (FA/FA0) on a logarithmic scale from 0.001 to 1. Each agent is represented by distinct symbols and line styles.*
FDA Label Image

Fig-5 (Sevoflurane Fig 5)

Fig-5 (Sevoflurane Fig 5)
A line graph depicting serum fluoride levels (µM) over days post-anesthesia for five anesthetic agents: Methoxyflurane, Sevoflurane, Enflurane, Isoflurane, and Halothane. The y-axis measures serum fluoride concentration, and the x-axis shows days from pre-anesthesia to 6 days post-anesthesia, with error bars indicating variability. Sevoflurane shows a prominent peak around day 1 or 2 compared to others.*
FDA Label Image

Fig-6 (Sevoflurane Fig 6)

Fig-6 (Sevoflurane Fig 6)
A line graph showing concentration (Conc) in micromolar (µM) on the y-axis versus time in hours (hrs) on the x-axis, ranging from 0 to 50 hours. The graph includes four lines representing mean concentration, mean concentration plus one standard deviation (sd), mean concentration plus two standard deviations, and mean concentration plus three standard deviations, depicting the decline in concentration over time.*
FDA Label Image

Fig-7 (Sevoflurane Fig 7)

Fig-7 (Sevoflurane Fig 7)
A line graph comparing the beats per minute (Beat/min) at baseline and different MAC levels (1, 1.5, 2) for Sevoflurane with O2 and Sevoflurane with O2/N2O. Data points include error bars for variability.*
FDA Label Image

Fig-8 (Sevoflurane Fig 8)

Fig-8 (Sevoflurane Fig 8)
A line graph depicting the relationship between MAC level (x-axis) and mmHg (y-axis) for two treatments: Sevoflurane with Oxygen (Sevo/O2) and Sevoflurane with Oxygen and Nitrous Oxide (Sevo/O2/N2O). Error bars are shown indicating variability for each data point.*
FDA Label Image

Fig-9 (Sevoflurane Fig 9)

Fig-9 (Sevoflurane Fig 9)
A line graph depicting the relationship between MAC level and a variable measured in dynes·sec·cm⁻⁵. The graph compares two groups: A - Sevo/O₂ and C - Sevo/O₂/N₂O, with data points presented at baseline and across increasing MAC levels.*
FDA Label Image

Sevoflurane-structural-formula (Sevoflurane Structural Formula)

Sevoflurane-structural-formula (Sevoflurane Structural Formula)
Chemical structure of sevoflurane showing carbon, hydrogen, fluorine, and oxygen atoms arranged in its molecular formula representation.*

* About these descriptions: Image descriptions on this page are generated by automated AI analysis of the product label images from the manufacturer's FDA label submission (SPL). They are provided for reference only and may contain errors or omissions. Always rely on the printed label itself and the official FDA labeling, and consult a pharmacist or healthcare professional with any questions about this product.