Samsca Tablet
Product Images NDC 59148-021

6 FDA label images from Otsuka America Pharmaceutical, Inc. · Packaging, Regulatory Labels, and Product Appearance

Product Visual Gallery

This gallery contains 6 technical images submitted to the FDA as part of the official labeling for Samsca (NDC 59148-021). Unlike standard consumer photos, these assets often include clinical data figures, molecular chemical structures, and official manufacturer packaging layouts.

As provided by Otsuka America Pharmaceutical, Inc., these visuals offer a comprehensive scientific overview of the product's physical and chemical identity, aiding pharmacists and researchers in product verification and study.

FDA Label Image

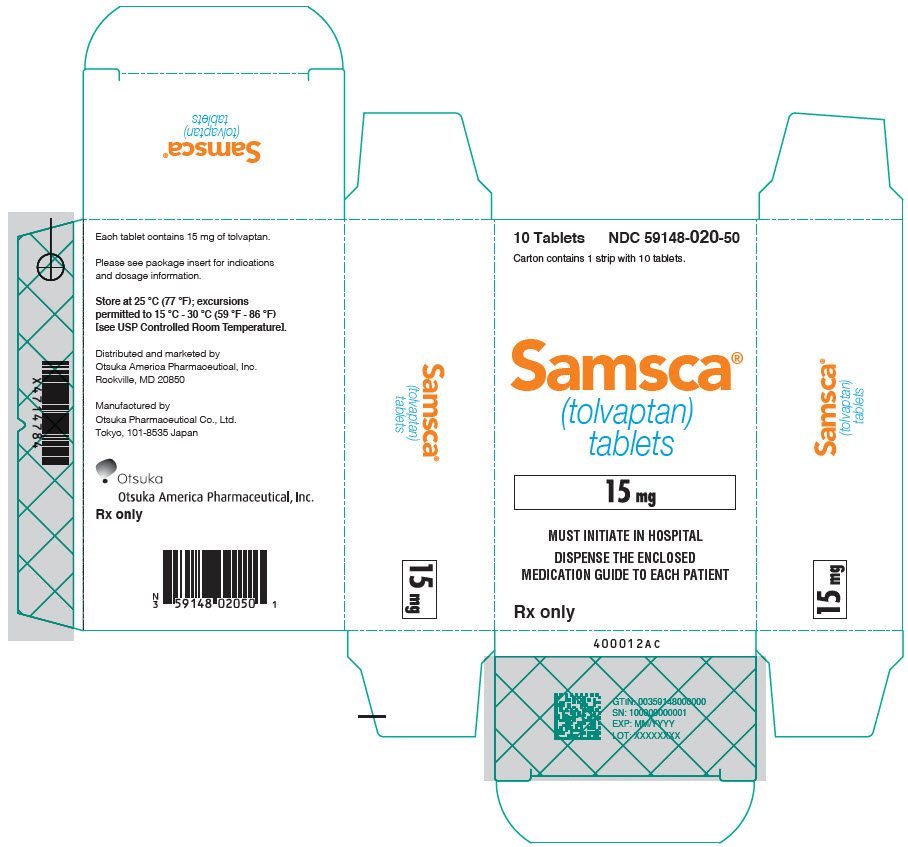
Samsca 15mg Ctn

Samsca 15mg Ctn
SAMSCA 15 mg tablets packaging label for oral administration. The carton contains 10 tablets, with tolvaptan as the active ingredient. Label includes storage instructions, distributor Otsuka America Pharmaceutical, Inc., and manufacturer Otsuka Pharmaceutical Co., Ltd. It states Rx only, hospital initiation, and dispensing of the enclosed medication guide.*
FDA Label Image

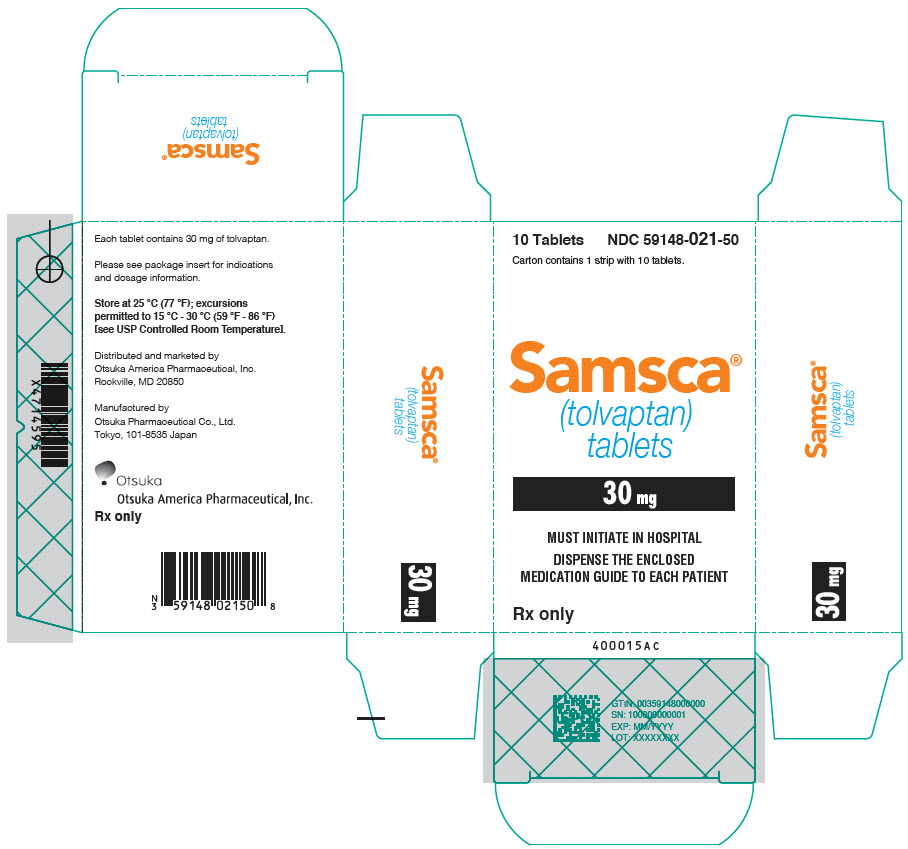
Samsca 30mg Ctn

Samsca 30mg Ctn
Packaging label for Samsca (tolvaptan) 30 mg tablets by Otsuka America Pharmaceutical, Inc. The carton contains 10 oral tablets with a hospital initiation warning and note to dispense the enclosed medication guide. The label includes storage instructions, manufacturer details from Tokyo, Japan, and features the Rx only designation.*
FDA Label Image

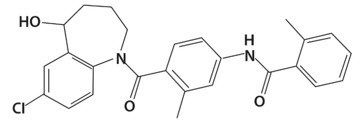
Samsca Chem Structure

Samsca Chem Structure
Chemical structure of tolvaptan, the active ingredient in SAMSCA tablets. The diagram shows tolvaptan's molecular framework with labeled rings and functional groups relevant to its chemical composition.*
FDA Label Image

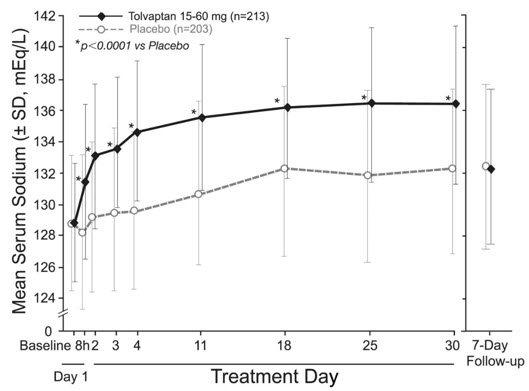
Samsca Figure 01

Samsca Figure 01
A line graph depicting mean serum sodium levels (mEq/L) with standard deviation over treatment days for Tolvaptan 15-60 mg versus placebo. The x-axis shows baseline, hours within day 1, days 3 to 30, and 7-day follow-up. Tolvaptan shows a higher mean serum sodium increase compared to placebo, with statistically significant differences marked.*
FDA Label Image

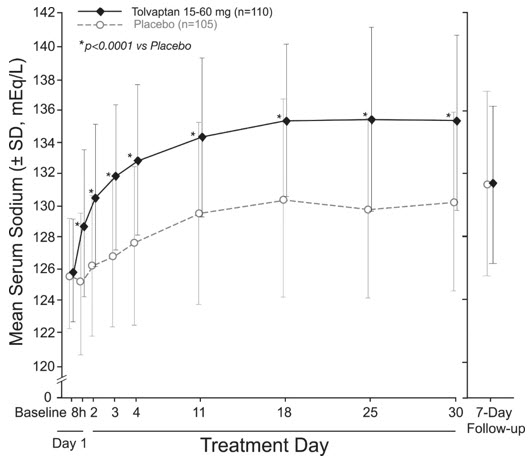
Samsca Figure 02

Samsca Figure 02
Line graph comparing mean serum sodium levels (mEq/L) over treatment days between tolvaptan 15-60 mg and placebo groups. The graph shows increasing sodium levels in the tolvaptan group, remaining higher than placebo across days 1 to 30, with markers indicating statistical significance versus placebo. A 7-day follow-up sodium level is also plotted for tolvaptan.*
FDA Label Image

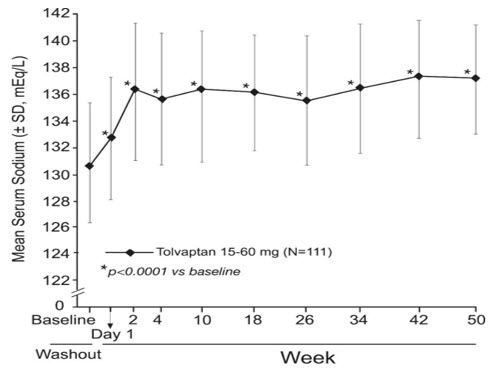
Samsca Figure 03

Samsca Figure 03
A line graph depicting mean serum sodium levels (mEq/L) with standard deviation over time from baseline through week 50, for patients treated with Tolvaptan 15-60 mg (N=111). The x-axis represents time in weeks, and significant changes from baseline are marked with asterisks. The graph shows an initial rise in serum sodium levels, which then stabilize with slight fluctuations over the study period.*

* About these descriptions: Image descriptions on this page are generated by automated AI analysis of the product label images from the manufacturer's FDA label submission (SPL). They are provided for reference only and may contain errors or omissions. Always rely on the printed label itself and the official FDA labeling, and consult a pharmacist or healthcare professional with any questions about this product.