Figure 1 (Image 1)
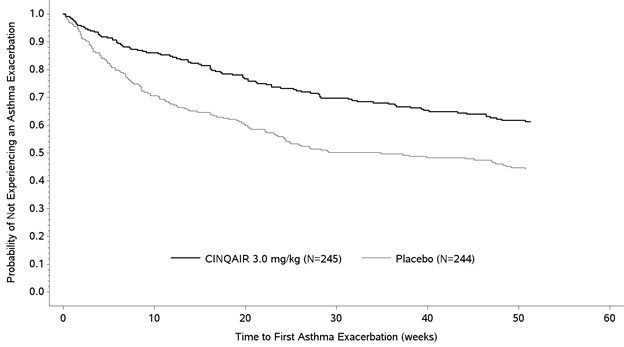
This is a graphic representation of the probability of not experiencing an asthma exacerbation over time, comparing the effects of CINQAIR 3.0 mg/kg and placebo in a sample of 245 and 264 subjects respectively. The x-axis represents time to first asthma exacerbation in weeks, and the y-axis represents the probability of not experiencing an exacerbation.*