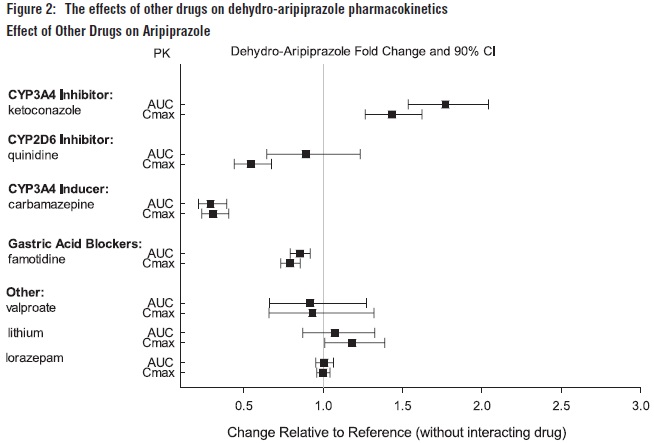
Figure 1: The Effects Of Other Drugs On Aripiprazole Pharmacokinetics (Aripiprazole Fig1)
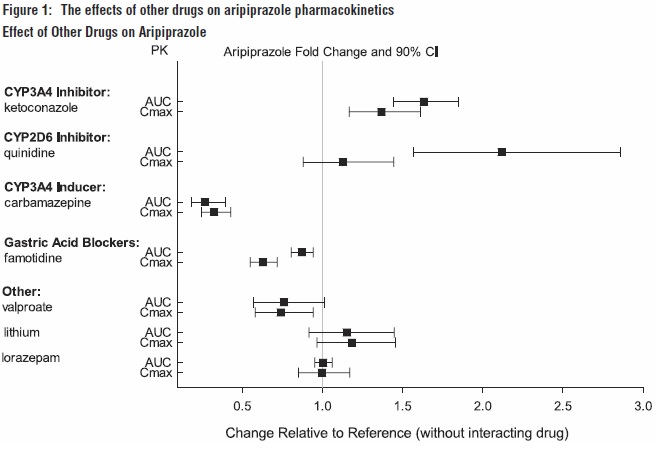
The diagram displays the effects of various drugs on the metabolism of Aripiprazole, a medication used to treat certain mental conditions. The drugs are divided into categories, such as CYP3A4 inhibitors and inducers, CYP2D6 inhibitors, Gastric Acid Blockers, and others. The fold change and 90% confidence interval of the Aripiprazole pharmacokinetics are indicated on the Y-axis, and the relative change in comparison to a reference point (without interacting drug) is on the X-axis. The drugs listed in the diagram include Keloconazoe, quinidine, carbamazepine, famolidine, valroste, lithium, and lorazepam.*