Letrozole Tablet, Film Coated
Product Images NDC 59651-180

View Photos of Packaging, Regulatory Labels, and Product Appearance

Product Visual Gallery

This gallery contains 7 technical images submitted to the FDA as part of the official labeling for Letrozole (NDC 59651-180). Unlike standard consumer photos, these assets often include clinical data figures, molecular chemical structures, and official manufacturer packaging layouts.

As provided by Aurobindo Pharma Limited, these visuals offer a comprehensive scientific overview of the product's physical and chemical identity, aiding pharmacists and researchers in product verification and study.

FDA Label Image

Figure1 (Letrozole Fig1)
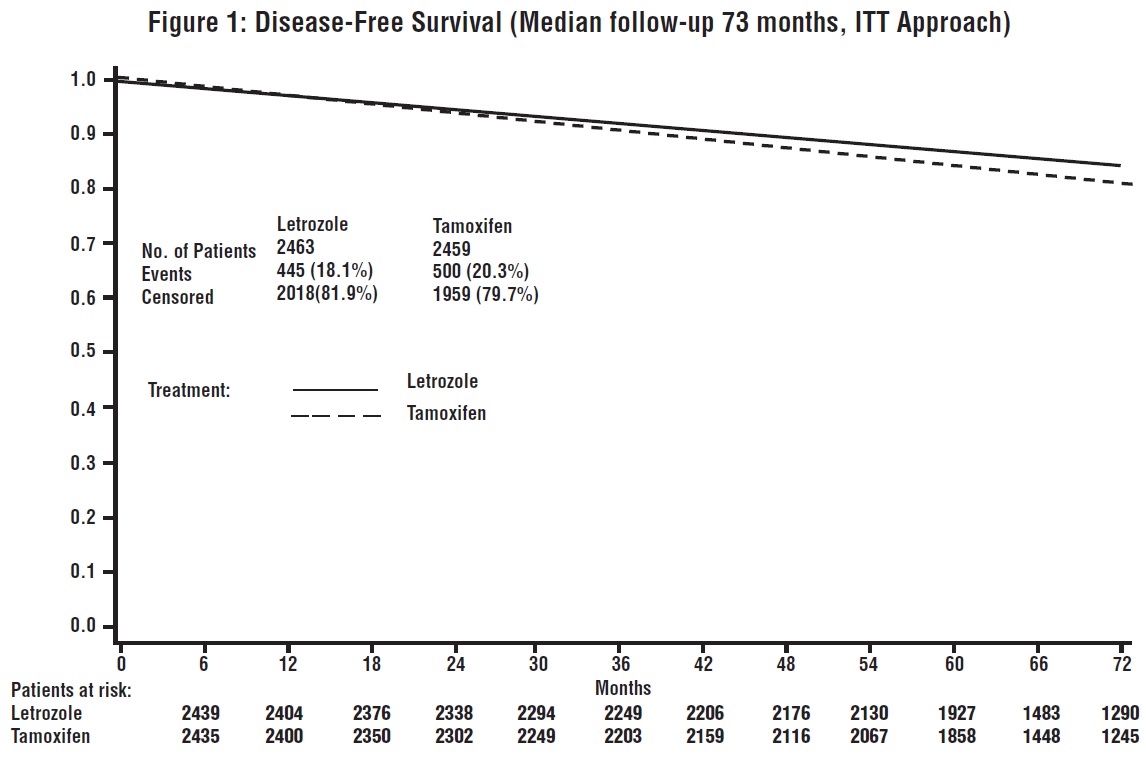
Figure1 (Letrozole Fig1)
A line chart titled 'Disease-Free Survival (Median follow-up 73 months, ITT Approach)' comparing Letrozole and Tamoxifen treatments over 72 months. The y-axis shows survival probability from 0.0 to 1.0, and the x-axis shows months from 0 to 72. Letrozole is represented by a solid line and Tamoxifen by a dashed line. Patient numbers at risk and event/censored data are provided for both treatments.*
FDA Label Image

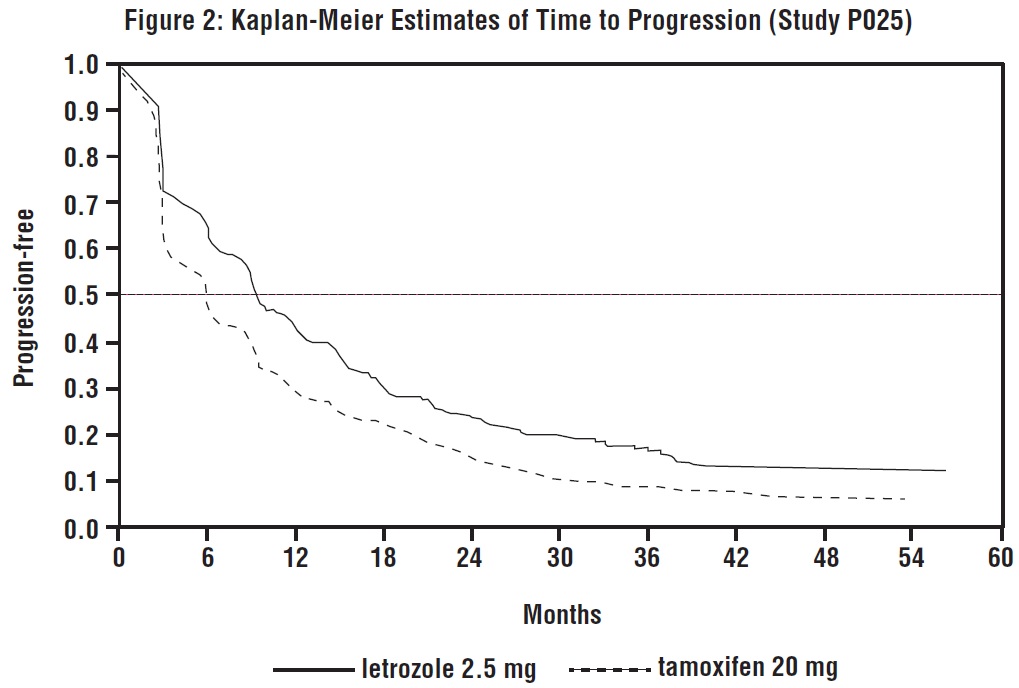
Figure 2 (Letrozole Fig2)

Figure 2 (Letrozole Fig2)
A Kaplan-Meier curve graph showing estimates of time to progression from Study P025. The x-axis represents months (0 to 60), and the y-axis shows the proportion progression-free (0.0 to 1.0). Two lines compare letrozole 2.5 mg (solid) and tamoxifen 20 mg (dashed), illustrating progression-free survival over time.*
FDA Label Image

Figure 3 (Letrozole Fig3)

Figure 3 (Letrozole Fig3)
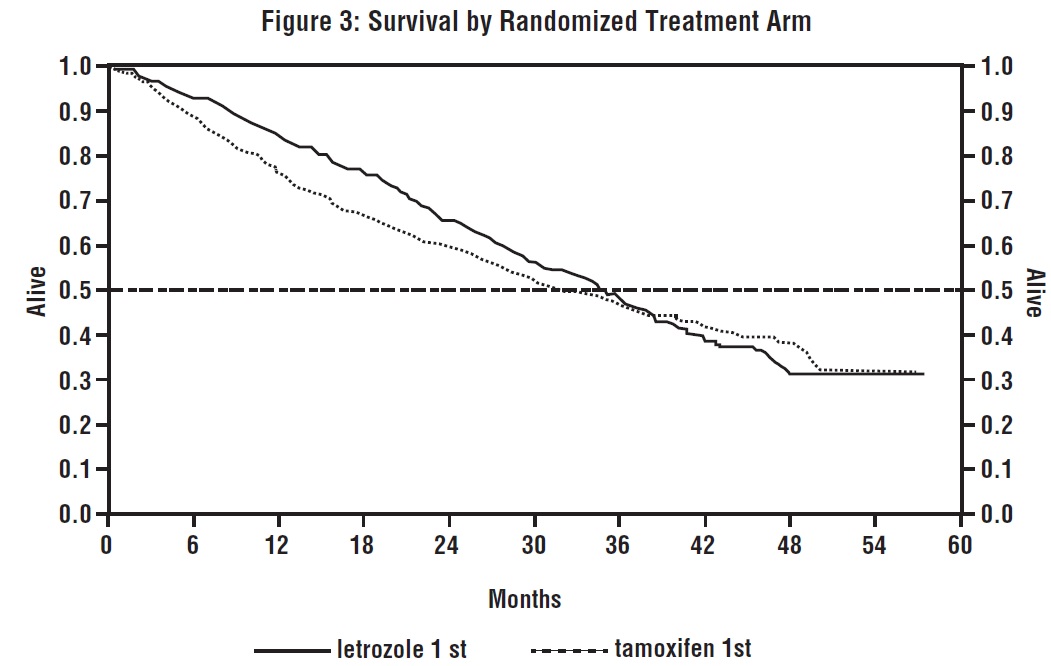
A survival curve chart titled 'Figure 3: Survival by Randomized Treatment Arm' comparing survival rates over 60 months between two treatment groups: letrozole 1st and tamoxifen 1st. The y-axis represents the proportion alive, ranging from 0.0 to 1.0, and the x-axis indicates time in months from 0 to 60. The chart shows a higher survival proportion for the letrozole group over time compared to the tamoxifen group.*
FDA Label Image

Figure4 (Letrozole Fig4)

Figure4 (Letrozole Fig4)
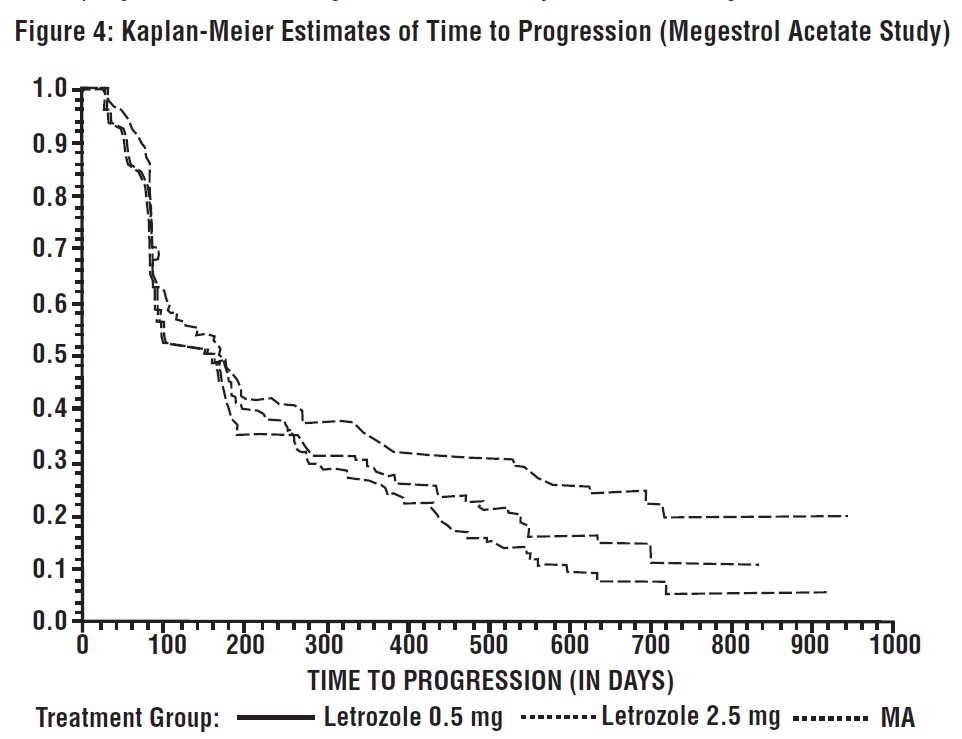
A Kaplan-Meier curve chart titled 'Kaplan-Meier Estimates of Time to Progression (Megestrol Acetate Study)' showing time to progression in days on the x-axis and proportion remaining on the y-axis. The chart includes three treatment groups: Letrozole 0.5 mg, Letrozole 2.5 mg, and Megestrol Acetate (MA), each represented by different dashed or solid lines depicting progression over nearly 1000 days.*
FDA Label Image

Figure5 (Letrozole Fig5)

Figure5 (Letrozole Fig5)
A Kaplan-Meier curve graph showing estimates of time to progression in days for an Aminoglutethimide study. The x-axis represents time to progression (0 to 1000 days) and the y-axis shows the proportion surviving (0 to 1.0). The graph includes three treatment groups: Letrozole 0.5 mg, Letrozole 2.5 mg, and AG, each represented by different line types.*
FDA Label Image

Package Label.principal Display Panel (2.5 mg Container Label (30 Tablets))

Package Label.principal Display Panel (2.5 mg Container Label (30 Tablets))
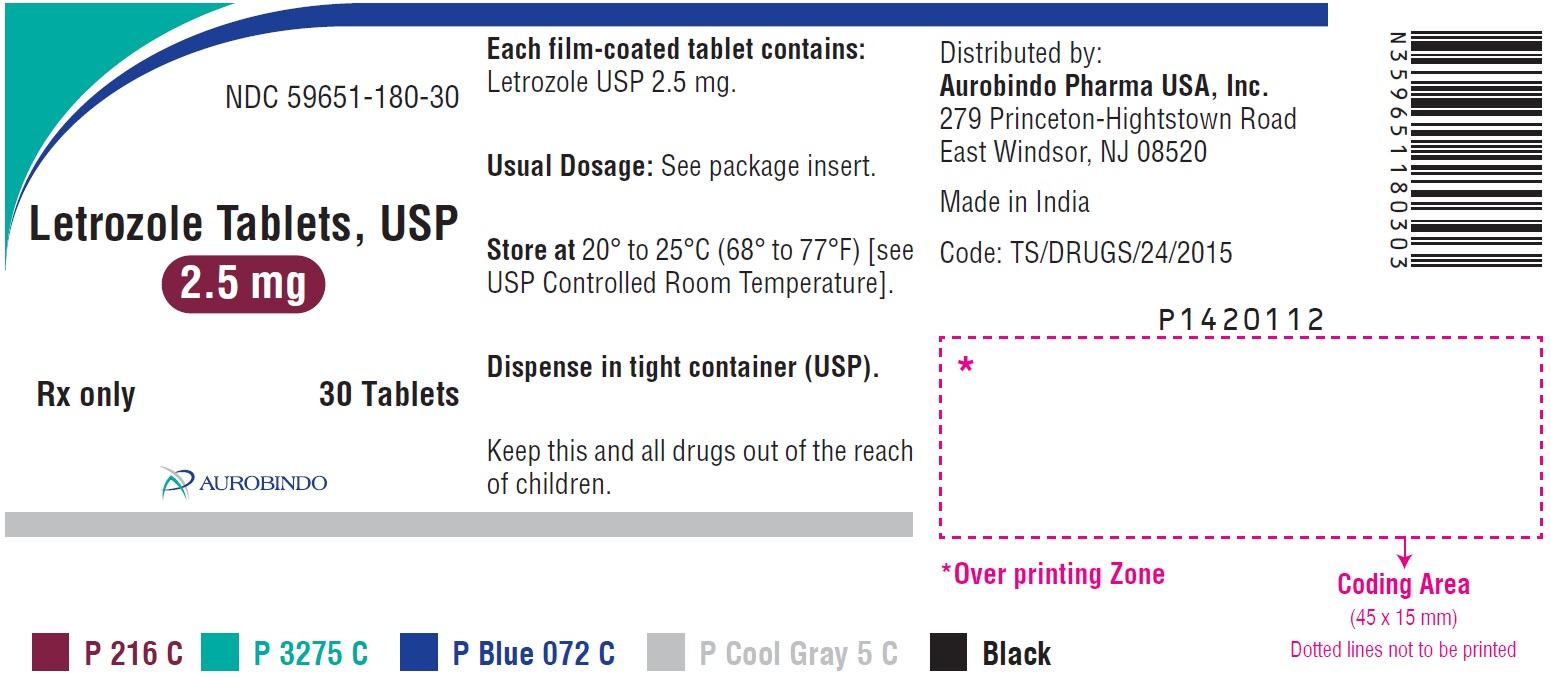
Label for Letrozole Tablets, USP 2.5 mg film-coated tablets, oral administration. The label indicates a package size of 30 tablets and states the product is distributed by Aurobindo Pharma USA, Inc. It includes storage instructions and a barcode. The labeler is Aurobindo Pharma Limited, with NDC 59651-180-30 visible.*
FDA Label Image

Structure (Letrozole Str)

Structure (Letrozole Str)
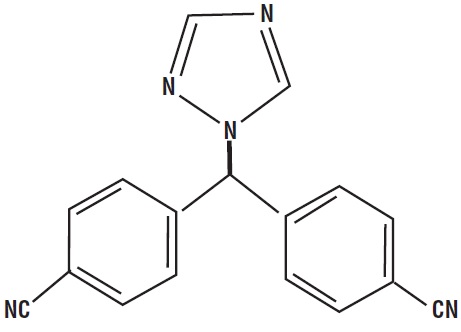
Chemical structure of Letrozole shown as a 1,2,4-triazole ring connected to two benzene rings, each substituted with a nitrile group (CN). The structure depicts the molecular framework of the active ingredient Letrozole.*

* About these descriptions: Image descriptions on this page are generated by automated AI analysis of the product label images from the manufacturer's FDA label submission (SPL). They are provided for reference only and may contain errors or omissions. Always rely on the printed label itself and the official FDA labeling, and consult a pharmacist or healthcare professional with any questions about this product.