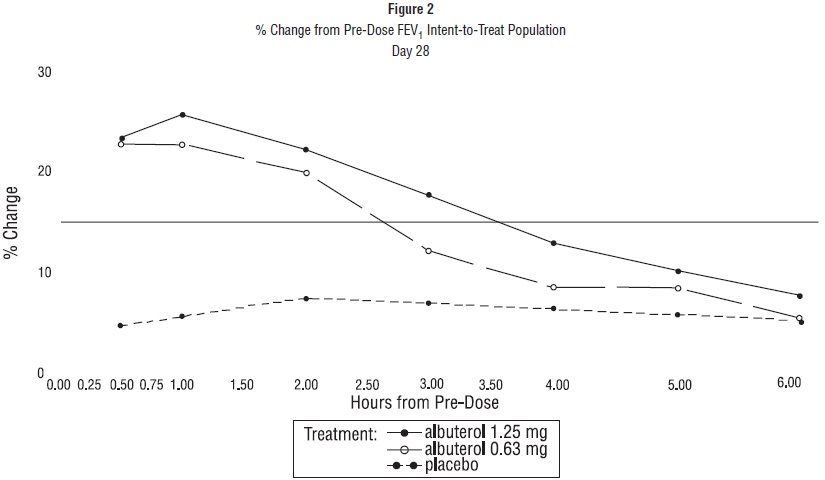
Figure 1 % Change From Pre-dose Fev1 Intent-to-treat Population Day 1 (Albuterol Fig1)
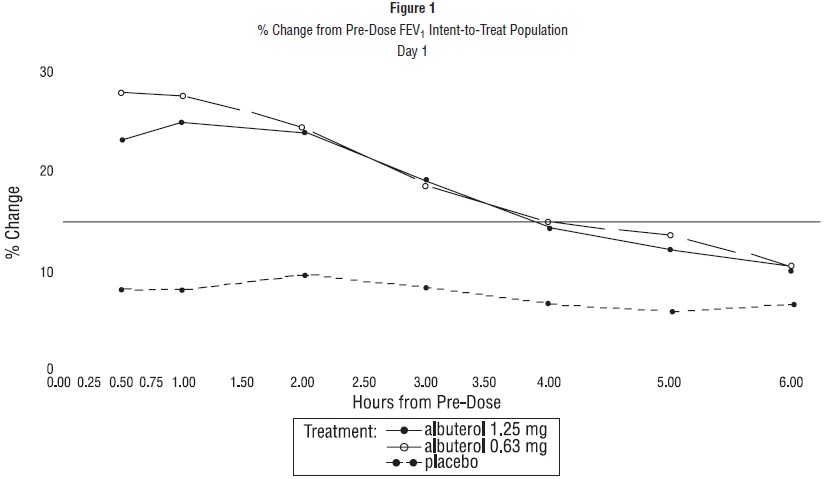
The text is a graph titled "% Change from Pre-Dose FEV, Intent-to-Treat Population". It shows the results of a treatment with albuterol (1.25mg and 0.63mg) and a placebo over time in hours. The y-axis displays percentage change and the x-axis is time in hours from pre-dose. There is no further information.*