Figure 1 (Pirfenidone Fig1)
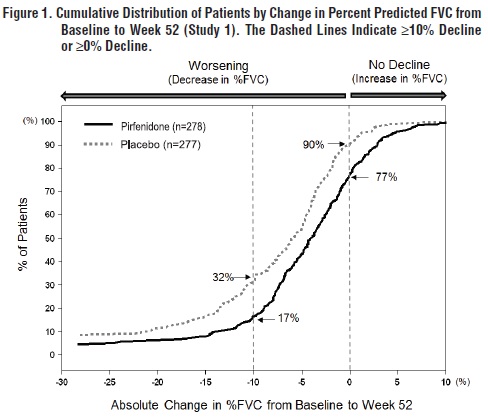
The text provides a figure showing the Cumulative Distribution of Patients based on the Change in Percent Predicted FVC from Baseline to Week 52 in Study 1. The dashed lines represent a decline of greater than 10% or 20%. The figure illustrates the percentage of patients experiencing worsening (%FVC decrease) and those with no decline (increase in %FVC) over the specified period.*
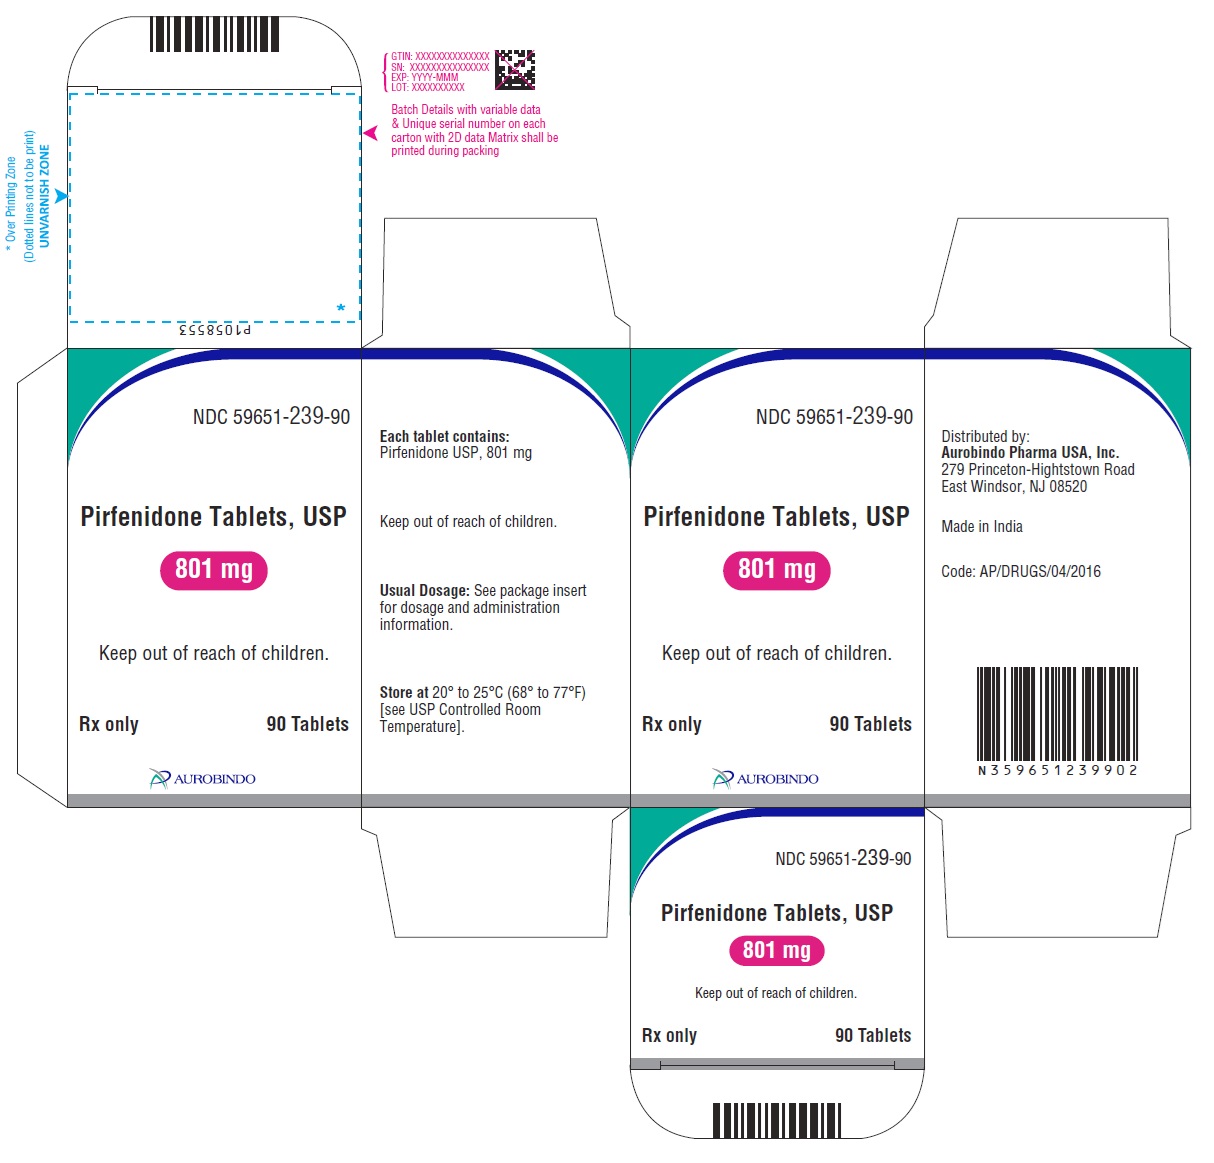
![Package Label-principal Display Panel (267 mg [270 Tablets (3 bottles of 90 each) Container Carton Label])](https://ndclist.com/assets/spl/images/50958060-c904-4374-997d-59df54007fa4/pirfenidone-fig7.jpg)