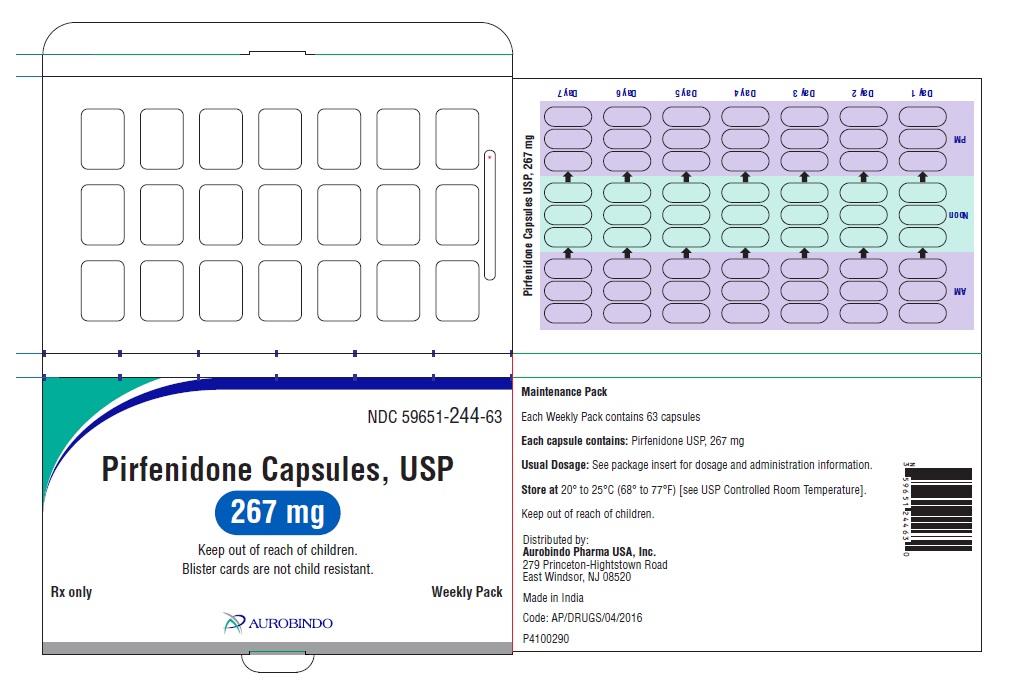
Figure1 (Pirfenidone Fig1)
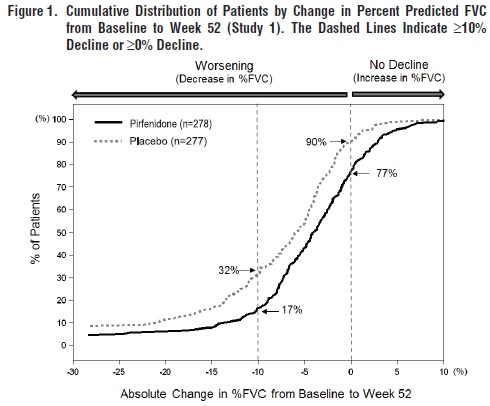
This is a description related to the Cumulative Distribution of Patients by Change in Percent Predicted FVC from Baseline to Week 52 in a study (Study 1). The Figure shows the distribution with Dashed Lines indicating either a decline of more than 10% or no decline. It also illustrates worsening with a decrease in %FVC and improvement with an increase in %FVC. The data presents the distribution of patients based on the absolute change in %FVC from Baseline to Week 52.*