Figure1 (Montelukast Fig1)
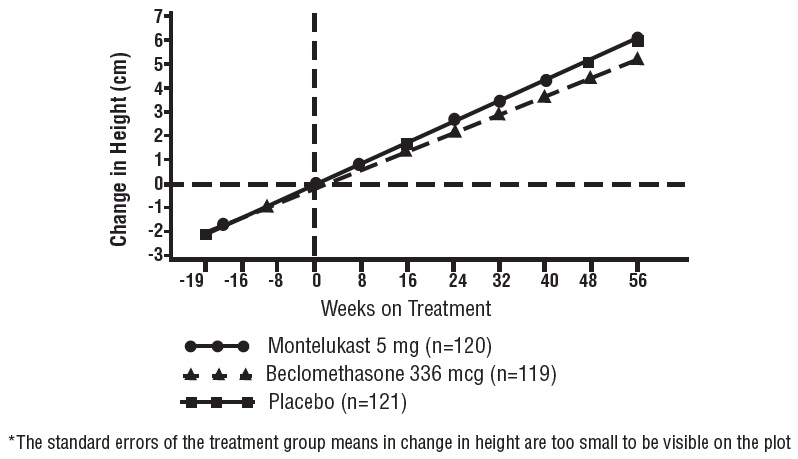
The graph shows the change in height in centimeters over a period of 56 weeks for three different groups: a group taking Montelukast 5 mg (120 participants), a group taking Beclomethasone 336 mg (119 participants), and a group taking a placebo (121 participants). The x-axis represents the weeks on treatment and the y-axis represents the change in height in centimeters. However, the standard errors of the treatment group means in change in height are too small to be visible on the graph.*