Figure1 (Vigabatrin Fig1)
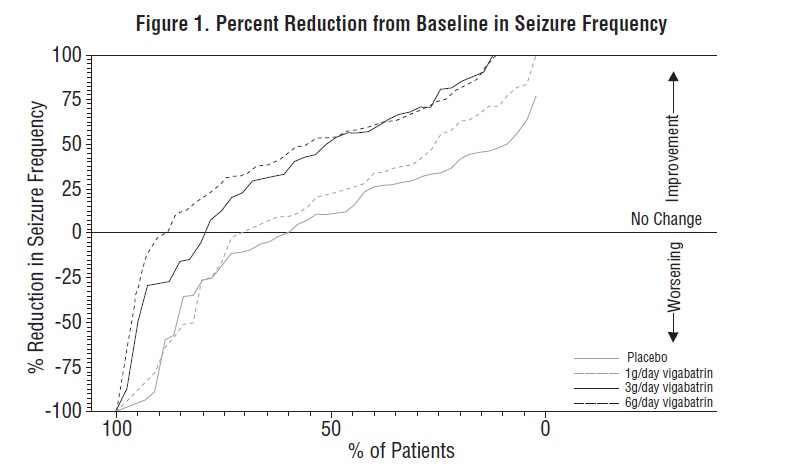
The text is a description of a figure showing the percent reduction from baseline in seizure frequency. The figure includes a scale from 0 to 50 on the y-axis showing the percentage of patients, and four treatment groups on the x-axis: placebo, 1g/day vigabatrin, 30/day vigabatrin, and 6g/day vigabatrin. For each group, there are three bars representing the percentage of patients who experienced improvement, no change, or worsening of their seizures.*