Figure1 (Roflumilast Fig1)
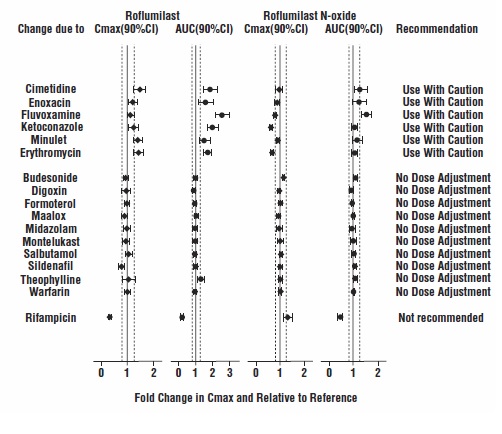
This appears to be a table of drug interactions or effects, indicating changes in maximum concentration (Cmax) and area under the curve (AUC) due to different medications. It also includes recommendations for adjusting doses or using caution when combining certain drugs. However, the specific drugs and their interactions are not legible due to errors.*

