Pregabalin Solution
Product Images NDC 59762-1576

View Photos of Packaging, Regulatory Labels, and Product Appearance

Product Visual Gallery

This gallery contains 26 technical images submitted to the FDA as part of the official labeling for Pregabalin (NDC 59762-1576). Unlike standard consumer photos, these assets often include clinical data figures, molecular chemical structures, and official manufacturer packaging layouts.

As provided by Mylan Pharmaceuticals Inc., these visuals offer a comprehensive scientific overview of the product's physical and chemical identity, aiding pharmacists and researchers in product verification and study.

FDA Label Image

Figure (Pregabalin 01)

Figure (Pregabalin 01)
An illustration showing the formula to calculate creatinine clearance (CLCr). The formula multiplies the difference of 140 minus age in years by weight in kilograms, adjusts for female patients by multiplying by 0.85, and divides by the product of 72 and serum creatinine in mg/dL.*
FDA Label Image

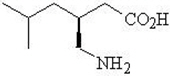
Chemical Structure (Pregabalin 02)

Chemical Structure (Pregabalin 02)
Chemical structure of pregabalin, showing its molecular arrangement with a carboxylic acid group (CO2H) and an amine group (NH2) attached to a branched carbon chain.*
FDA Label Image

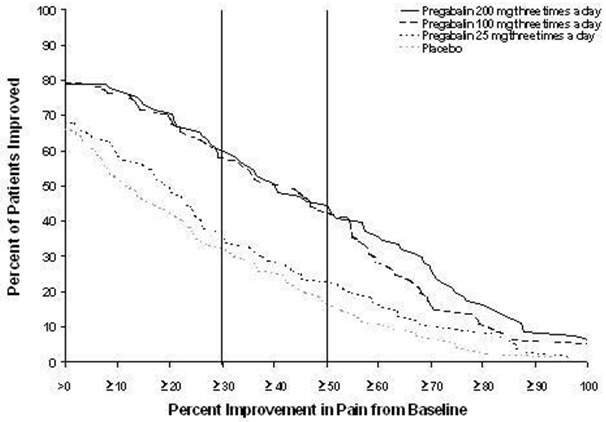
Figure 1 (Pregabalin 03)

Figure 1 (Pregabalin 03)
A line graph comparing the percent of patients improved at various percent improvements in pain from baseline. It shows four lines representing Pregabalin dosed at 200 mg, 100 mg, and 25 mg three times a day, and a placebo. The vertical axis indicates percent of patients improved, and the horizontal axis shows percent improvement in pain from baseline.*
FDA Label Image

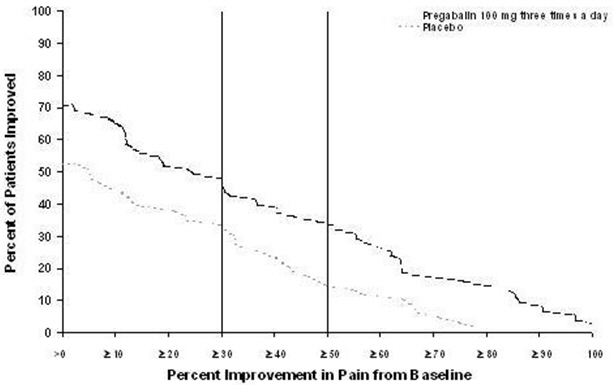
Figure 2 (Pregabalin 04)

Figure 2 (Pregabalin 04)
A line graph comparing percent improvement in pain from baseline on the horizontal axis with percent of patients improved on the vertical axis. Two curves are shown: one for Pregabalin 100 mg three times a day and the other for placebo. The graph illustrates higher patient improvement percentages for the Pregabalin group across varying pain improvement levels.*
FDA Label Image

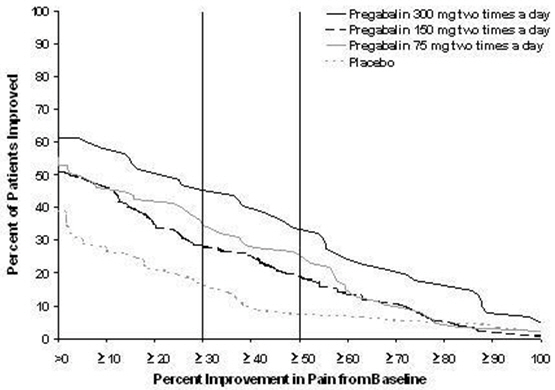
Figure 3 (Pregabalin 05)

Figure 3 (Pregabalin 05)
A line graph comparing the percent of patients improved versus percent improvement in pain from baseline for Pregabalin oral solution at three different dosages (75 mg, 150 mg, and 300 mg, each taken twice a day) and a placebo. The graph shows improvement trends across a pain reduction scale from 0 to 100 percent.*
FDA Label Image

Figure 4 (Pregabalin 06)

Figure 4 (Pregabalin 06)
A line graph showing the percentage of patients improved versus percent improvement in pain from baseline for three groups: Pregabalin 200 mg three times a day, Pregabalin 100 mg three times a day, and Placebo. The graph plots decreasing trends across the improvement scale for each group.*
FDA Label Image

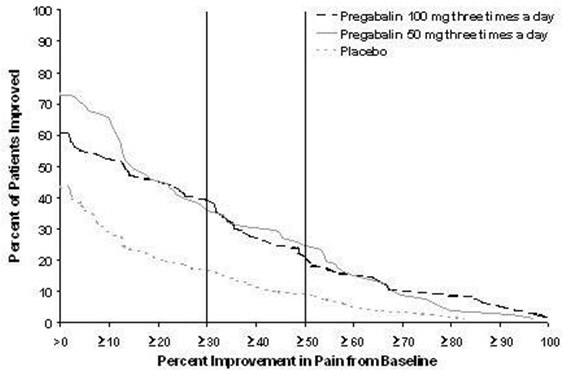
Figure 5 (Pregabalin 07)

Figure 5 (Pregabalin 07)
A line graph showing the percent improvement in pain from baseline on the x-axis, ranging from greater than 0 to 100, and the percent of patients improved on the y-axis, ranging from 0 to 100 percent. The graph compares three groups: Pregabalin 100 mg three times a day, Pregabalin 50 mg three times a day, and placebo, with two vertical lines marking improvement thresholds at 30% and 50%.*
FDA Label Image

Figure 6 (Pregabalin 08)

Figure 6 (Pregabalin 08)
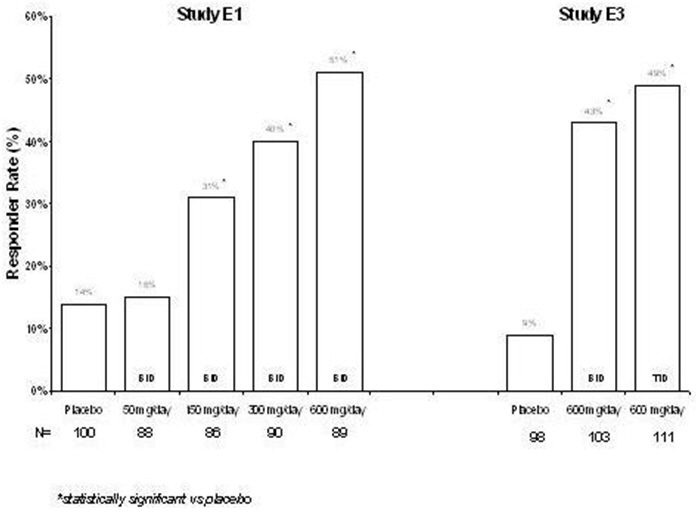
A bar chart presenting responder rates (%) from two clinical studies, Study E1 and Study E3, comparing placebo and various daily doses of an oral solution. The vertical axis shows responder rates from 0% to 60%. The horizontal axis lists placebo and increasing dosages (50 mg/day to 600 mg/day) for Study E1 and placebo, 600 mg once daily, and 600 mg thrice daily for Study E3, with sample sizes indicated below each group. Statistically significant increases vs placebo are noted by asterisks above certain bars.*
FDA Label Image

Figure 7 (Pregabalin 09)

Figure 7 (Pregabalin 09)
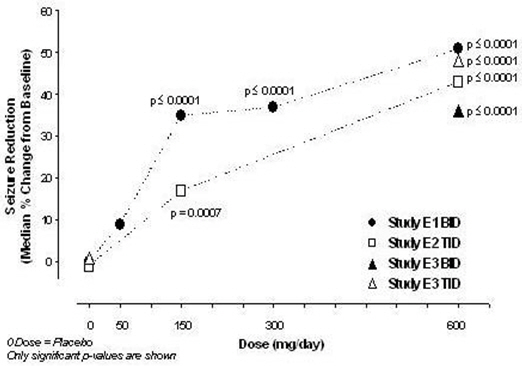
A line graph showing the relationship between dose (mg/day) and median seizure reduction (% change from baseline) across four studies labeled E1 BD, E2 TID, E3 BD, and E3 TID. The graph includes dose points from 0 to 600 mg/day and indicates statistically significant p-values at various dose levels for each study.*
FDA Label Image

Figure 8 (Pregabalin 10)

Figure 8 (Pregabalin 10)
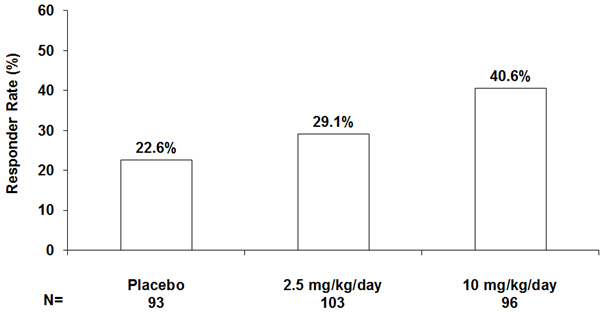
A vertical bar chart displaying responder rates (%) for Pregabalin at doses of 2.5 mg/kg/day and 10 mg/kg/day compared to Placebo. The x-axis shows three groups: Placebo (N=93), 2.5 mg/kg/day (N=103), and 10 mg/kg/day (N=96). The y-axis represents responder rate percentages from 0 to 60%, with bars indicating approximately 22.6% for Placebo, 29.1% for 2.5 mg/kg/day, and 40.6% for 10 mg/kg/day.*
FDA Label Image

Figure 9 (Pregabalin 11)

Figure 9 (Pregabalin 11)
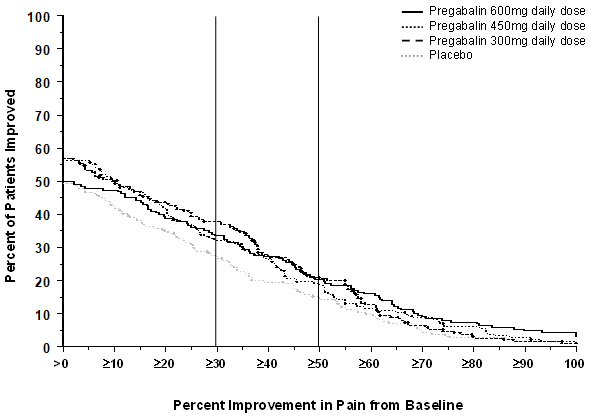
A line graph depicting the percent of patients improved against percent improvement in pain from baseline for Pregabalin at 600 mg, 450 mg, 300 mg daily doses, and placebo. The graph shows four distinct trend lines representing each dose and placebo, with percent improvement on the x-axis and percent of patients improved on the y-axis.*
FDA Label Image

Figure 10 (Pregabalin 12)

Figure 10 (Pregabalin 12)
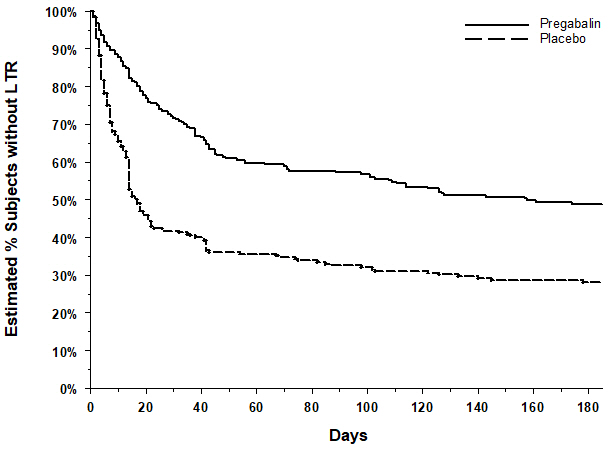
A line graph comparing the estimated percentage of subjects without LTR over 180 days between Pregabalin and placebo groups. The vertical axis represents the percentage of subjects without LTR from 0% to 100%, and the horizontal axis represents time in days from 0 to 180. The Pregabalin group shows a higher percentage of subjects without LTR over time compared to the placebo group.*
FDA Label Image

Figure 11 (Pregabalin 13)

Figure 11 (Pregabalin 13)
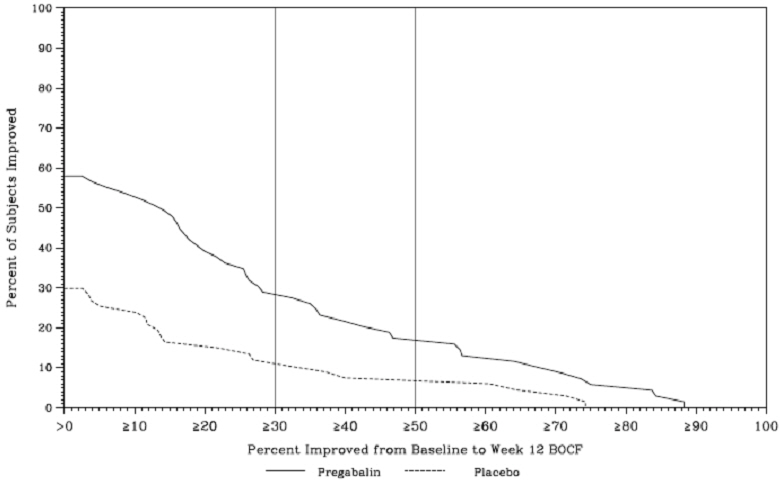
A line graph shows the percent of subjects improved from baseline to week 12 BOCF for Pregabalin versus placebo. The x-axis represents percent improvement ranging from 0 to 100, and the y-axis shows the percent of subjects improved. Two lines compare Pregabalin (solid) and placebo (dashed), with Pregabalin consistently showing higher percentages of subjects improved across the improvement range.*
FDA Label Image

Figure 12 (Pregabalin 14)

Figure 12 (Pregabalin 14)
A line graph comparing the percent of subjects improved from baseline to week 16 using the Percent Improved from Baseline to Week 16 BOCF on the x-axis and Percent of Subjects Improved on the y-axis. The graph shows two lines representing Pregabalin and Placebo, illustrating differences in subject improvement over the measured range.*
FDA Label Image

Logo (Pregabalin 15)

FDA Label Image

Logo (Pregabalin 15a)

FDA Label Image

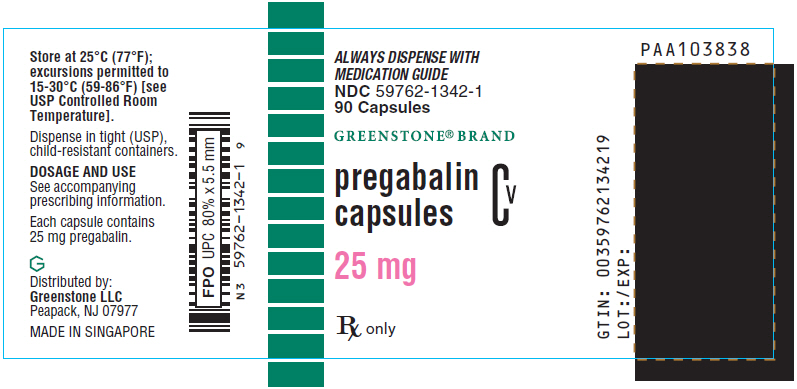
Principal Display Panel (25 mg Capsule Bottle Label)

Principal Display Panel (25 mg Capsule Bottle Label)
Label for pregabalin capsules 25 mg by Greenstone LLC. The label includes storage instructions, dispensing requirements, and indicates the package contains 90 capsules. Distributed by Greenstone LLC, Peapack, NJ, with the product made in Singapore. The label features barcodes and a NDC number 59762-1342-1.*
FDA Label Image

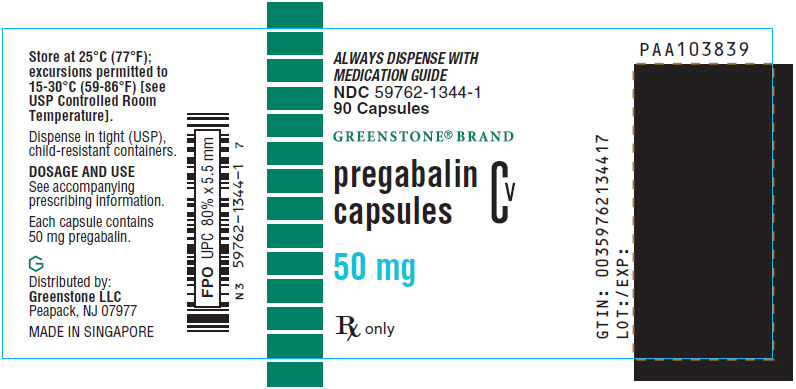
Principal Display Panel (50 mg Capsule Bottle Label)

Principal Display Panel (50 mg Capsule Bottle Label)
Label for Greenstone brand Pregabalin capsules 50 mg, a prescription human drug. The label includes storage instructions, dosage and use information, and distribution details by Greenstone LLC. The packaging specifies 90 capsules and highlights to dispense with the medication guide. The label also includes barcodes and regulatory information.*
FDA Label Image

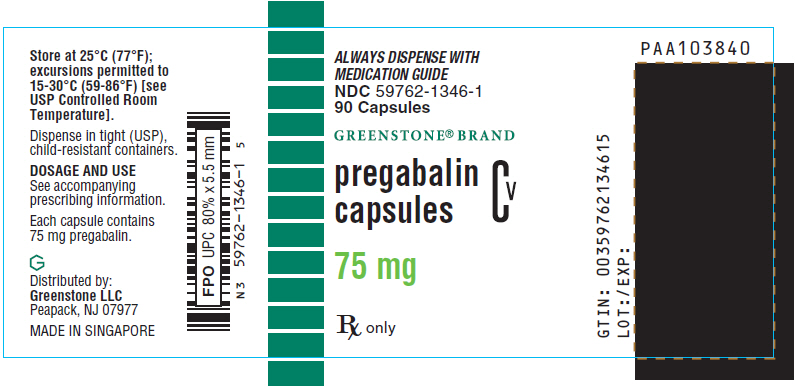
Principal Display Panel (75 mg Capsule Bottle Label)

Principal Display Panel (75 mg Capsule Bottle Label)
Pregabalin capsules 75 mg packaging label from Greenstone brand, distributed by Greenstone LLC. The label includes storage instructions at 25°C (77°F) with permitted excursions, dosage form as capsules, and container instructions. It features a barcode and NDC-related information.*
FDA Label Image

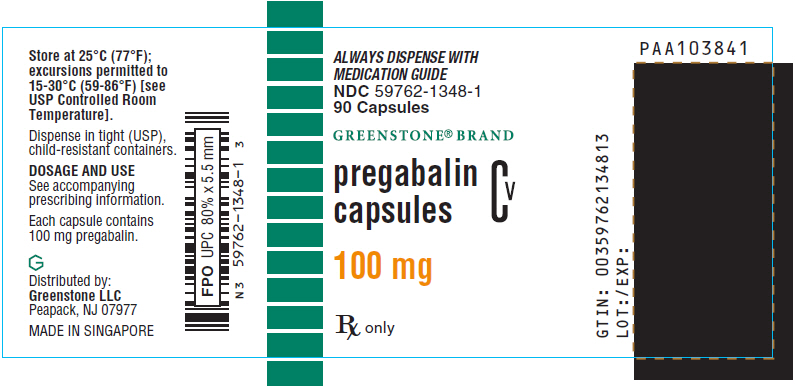
Principal Display Panel (100 mg Capsule Bottle Label)

Principal Display Panel (100 mg Capsule Bottle Label)
The image shows a medication label for Greenstone Brand Pregabalin capsules, 100 mg strength. The label includes dosage and storage instructions, showing 90 capsules per container. It mentions the product is distributed by Greenstone LLC and made in Singapore. The label also includes an NDC barcode and states to dispense with a medication guide.*
FDA Label Image

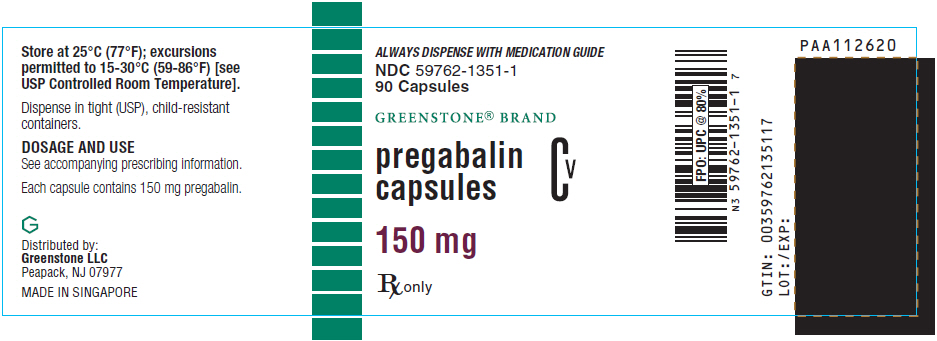
Principal Display Panel (150 mg Capsule Bottle Label)

Principal Display Panel (150 mg Capsule Bottle Label)
Label for Pregabalin capsules 150 mg by Greenstone LLC. The label includes storage instructions, dosage information, and a barcode. It specifies prescription-only status and mentions distribution by Greenstone LLC, Peapack, NJ. The capsules are made in Singapore and come in a bottle of 90 capsules.*
FDA Label Image

Principal Display Panel (200 mg Capsule Bottle Label)

Principal Display Panel (200 mg Capsule Bottle Label)
Label for Pregabalin capsules 200 mg from the Greenstone brand, distributed by Greenstone LLC. The label includes storage instructions, dosage information stating each capsule contains 200 mg pregabalin, and a quantity of 90 capsules. It features a barcode and lot/expiration date section. The medication is prescription only.*
FDA Label Image

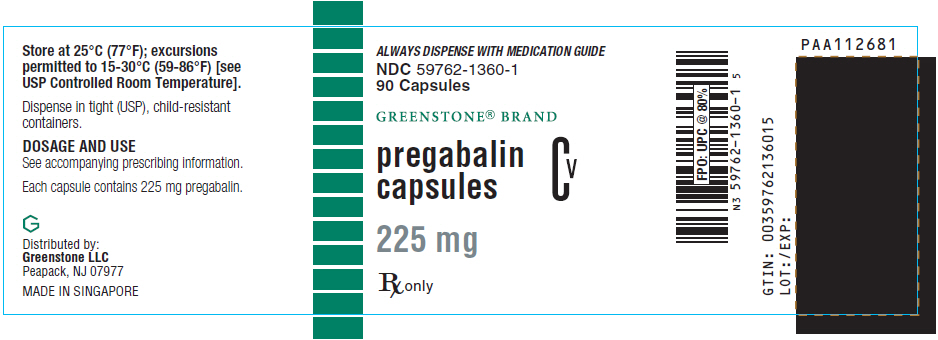
Principal Display Panel (225 mg Capsule Bottle Label)

Principal Display Panel (225 mg Capsule Bottle Label)
Pregabalin capsules label showing a strength of 225 mg per capsule. The label includes Greenstone brand name, Distributed by Greenstone LLC, Peapack, NJ, Made in Singapore, and storage instructions. It states Rx only and features barcodes and NDC number 59762-1360-1. The dosage form is capsules, not solution.*
FDA Label Image

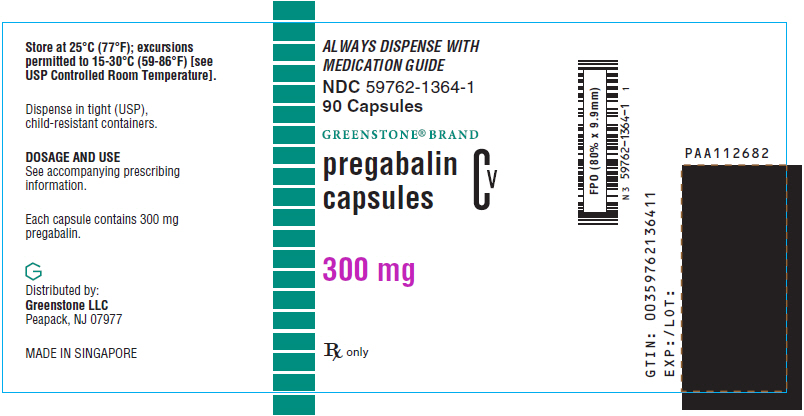
Principal Display Panel (300 mg Capsule Bottle Label)

Principal Display Panel (300 mg Capsule Bottle Label)
Label for Pregabalin capsules 300 mg, Greenstone brand, distributed by Greenstone LLC. The label instructs storage at 25°C with permitted excursions, dispensing in child-resistant containers, and notes the product is prescription only. The label also includes NDC 59762-1364-1 and package quantity of 90 capsules.*
FDA Label Image

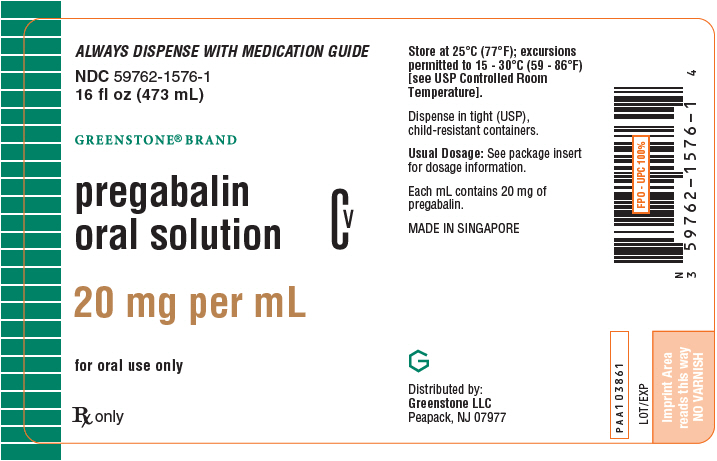
Principal Display Panel (473 mL Bottle Label)

Principal Display Panel (473 mL  Bottle Label)
Label for Pregabalin oral solution 20 mg per mL, 16 fl oz (473 mL) available from Greenstone LLC, Peapack, NJ. The label includes storage instructions, dosage guidance reference, and indicates the product is for oral use only and prescription use. The product is made in Singapore and distributed by Greenstone.*
FDA Label Image

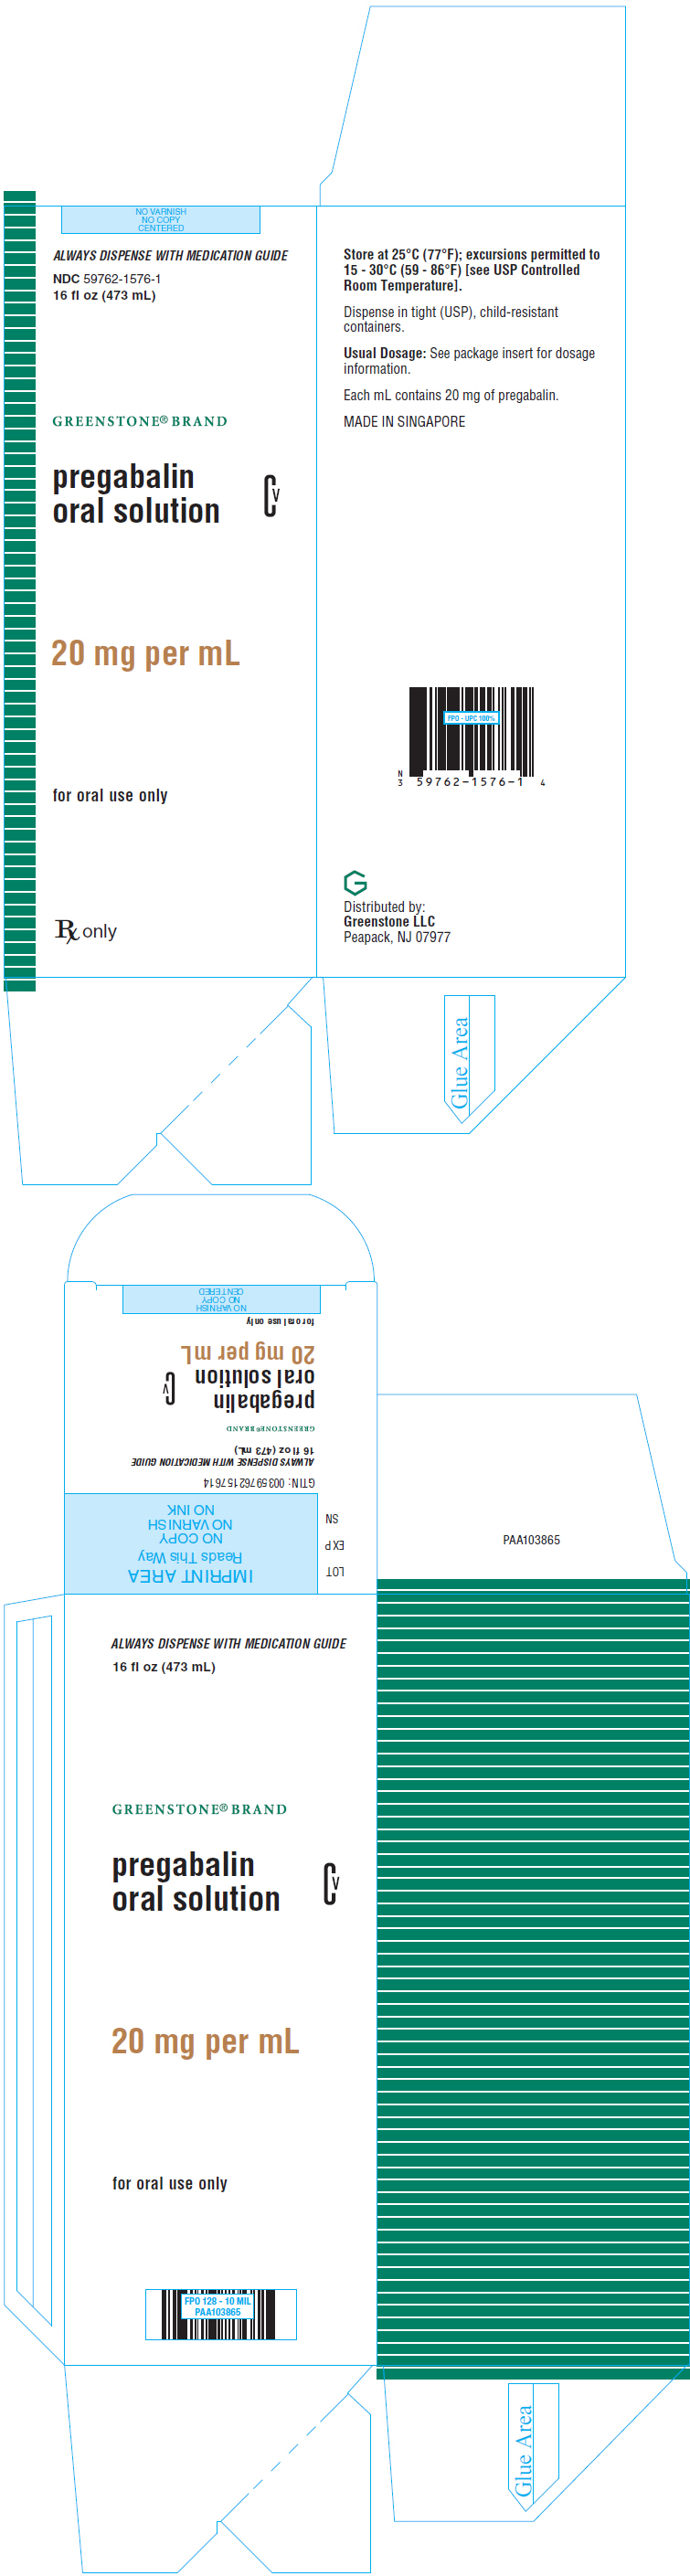
Principal Display Panel (473 mL Bottle Carton)

Principal Display Panel (473 mL  Bottle Carton)
Packaging label for Pregabalin oral solution 20 mg/mL, a human prescription drug by Mylan Pharmaceuticals Inc. The label indicates a 16 fl oz (473 mL) bottle, Greenstone brand. It includes storage instructions, dosage information, and the distributor Greenstone LLC in Peapack, NJ. The label features dosage strength, route, prescription status, and barcodes.*

* About these descriptions: Image descriptions on this page are generated by automated AI analysis of the product label images from the manufacturer's FDA label submission (SPL). They are provided for reference only and may contain errors or omissions. Always rely on the printed label itself and the official FDA labeling, and consult a pharmacist or healthcare professional with any questions about this product.