Fludeoxyglucose Injection
Product Images NDC 60215-411

6 FDA label images from The University Of Texas Md Anderson Cancer Center · Packaging, Regulatory Labels, and Product Appearance

Product Visual Gallery

This gallery contains 6 technical images submitted to the FDA as part of the official labeling for Fludeoxyglucose (NDC 60215-411). Unlike standard consumer photos, these assets often include clinical data figures, molecular chemical structures, and official manufacturer packaging layouts.

As provided by The University Of Texas Md Anderson Cancer Center, these visuals offer a comprehensive scientific overview of the product's physical and chemical identity, aiding pharmacists and researchers in product verification and study.

FDA Label Image

Fdg Structure (Fdg Structure)
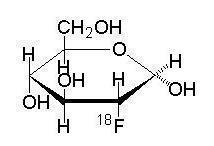
Fdg Structure (Fdg Structure)
Chemical structure of Fludeoxyglucose F18 depicted as a molecular diagram showing the arrangement of atoms and bonds including fluorine-18 isotope.*
FDA Label Image

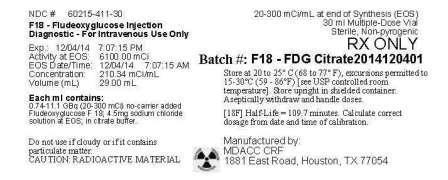
Fdgc Label Update (Compressed Fdgc 2014120401 Val)

Fdgc Label Update (Compressed Fdgc 2014120401 Val)
Fludeoxyglucose F18 injection label shows a 20-300 mCi/mL strength for intravenous use only, manufactured by The University of Texas MD Anderson Cancer Center. The label includes batch information, storage instructions (20 to 25°C), activity, volume (29.90 mL), and caution for radioactive material. The label is marked RX ONLY and sterile, non-pyrogenic.*
FDA Label Image

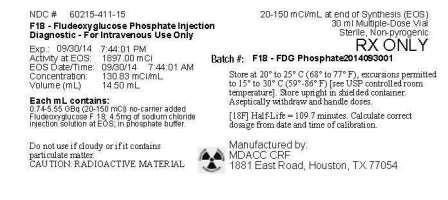
Fdgp Label Update (Compressed Fdgp 2014093001 Val)

Fdgp Label Update (Compressed Fdgp 2014093001 Val)
Fludeoxyglucose F18 Injection label from The University of Texas MD Anderson Cancer Center. The injectable drug is labeled for intravenous use with a concentration of 300 mCi/mL. The label includes batch information, radioactive material caution, and storage instructions, alongside the manufacturer address in Houston, TX.*
FDA Label Image

Table 2 (Table 2 Comp)

Table 2 (Table 2 Comp)
A data table titled 'Principal Radiation Emission Data for Fluorine F 18' presenting radiation types (Positron (β+) and Gamma (±)) with their percentage per disintegration and mean energy in keV. Positron emission shows 96.73% per disintegration at 249.8 keV, and Gamma emission shows 193.46% at 511.0 keV.*
FDA Label Image

Table 3 (Table3 (3))

Table 3 (Table3 (3))
A data table titled 'Table 3. Radiation Attenuation of 511 keV Photons by lead (Pb) shielding' showing the relationship between shield thickness in millimeters and the coefficient of attenuation. It presents values for shield thicknesses ranging from 0 to 52 mm with corresponding attenuation coefficients decreasing from 0 to 0.0001.*
FDA Label Image

Table 4 (Table4 (2))

Table 4 (Table4 (2))
A data table titled 'Physical Decay Chart for Fluorine F 18' displaying time in minutes alongside the fraction remaining. It lists fractions remaining at 0, 15, 30, 60, 110, and 220 minutes, showing how the quantity decreases over time.*

* About these descriptions: Image descriptions on this page are generated by automated AI analysis of the product label images from the manufacturer's FDA label submission (SPL). They are provided for reference only and may contain errors or omissions. Always rely on the printed label itself and the official FDA labeling, and consult a pharmacist or healthcare professional with any questions about this product.