Sildenafil Tablet, Film Coated
Product Images NDC 60219-1752

13 FDA label images from Amneal Pharmaceuticals Ny Llc · Packaging, Regulatory Labels, and Product Appearance

Product Visual Gallery

This gallery contains 13 technical images submitted to the FDA as part of the official labeling for Sildenafil (NDC 60219-1752). Unlike standard consumer photos, these assets often include clinical data figures, molecular chemical structures, and official manufacturer packaging layouts.

As provided by Amneal Pharmaceuticals Ny Llc, these visuals offer a comprehensive scientific overview of the product's physical and chemical identity, aiding pharmacists and researchers in product verification and study.

FDA Label Image

10 (Sildenafil Tablets 25 50 100 1)
10 (Sildenafil Tablets 25 50 100 1)
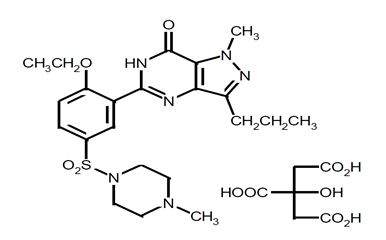
Chemical structure of Sildenafil, showing its molecular arrangement with labeled bonds and functional groups. The diagram includes carbon, nitrogen, oxygen, sulfur atoms, and associated bonds typical for this active ingredient.*
FDA Label Image

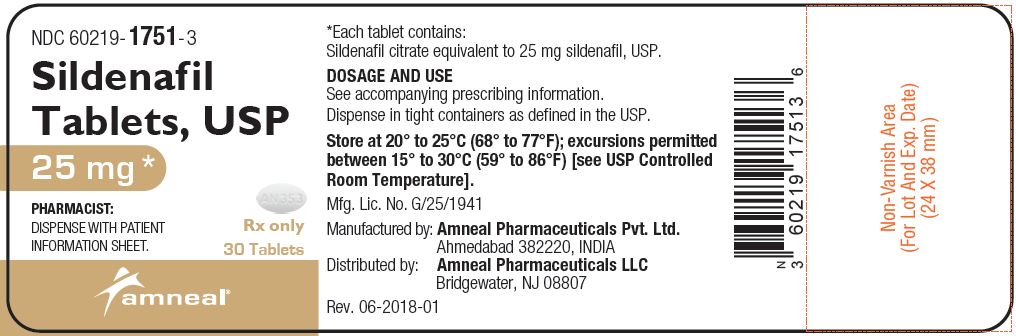
25 (Sildenafil Tablets 25 50 100 10)

25 (Sildenafil Tablets 25 50 100 10)
Sildenafil Tablets USP 25 mg film-coated tablets label showing NDC number 60219-1751-3. The label indicates the product contains sildenafil citrate equivalent to 25 mg sildenafil per tablet. Manufactured by Amneal Pharmaceuticals Pvt. Ltd. in India and distributed by Amneal Pharmaceuticals LLC, Bridgewater, NJ. The package contains 30 tablets with storage instructions for controlled room temperature.*
FDA Label Image

50 (Sildenafil Tablets 25 50 100 11)

50 (Sildenafil Tablets 25 50 100 11)
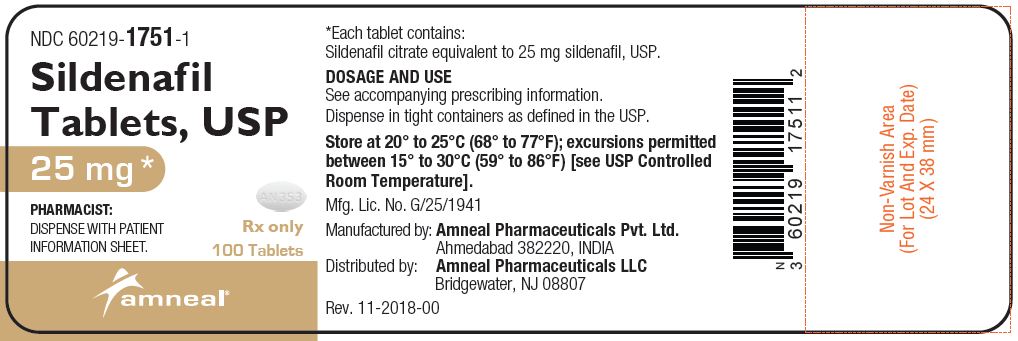
Sildenafil Tablets, USP 25 mg film-coated tablets label from Amneal Pharmaceuticals NY LLC. The label states the active ingredient quantity as sildenafil citrate equivalent to 25 mg sildenafil, USP, with a package count of 100 tablets. Storage instructions and manufacturing information including Amneal Pharmaceuticals Pvt. Ltd. in India and distribution by Amneal Pharmaceuticals LLC in NJ are visible.*
FDA Label Image

100 (Sildenafil Tablets 25 50 100 12)

100 (Sildenafil Tablets 25 50 100 12)
Sildenafil Tablets USP 50 mg film-coated oral tablets packaging label by Amneal Pharmaceuticals NY LLC. The label includes dosage form and strength information, NDC number 60219-1752-3, manufacturer and distributor details, storage instructions between 20° to 25°C, and pharmacist dispensing instructions. The package contains 30 tablets and is designated Rx only.*
FDA Label Image

Sildenafil Tablets 25 50 100 13

Sildenafil Tablets 25 50 100 13
Sildenafil Tablets USP 100 mg film-coated oral tablets label. The label indicates the strength as 100 mg and states the product is for prescription use only with a package size of 30 tablets. It is manufactured by Amneal Pharmaceuticals Pvt. Ltd. and distributed by Amneal Pharmaceuticals LLC. Storage instructions and dosage directions are briefly noted.*
FDA Label Image

10 (Sildenafil Tablets 25 50 100 2)

10 (Sildenafil Tablets 25 50 100 2)
A line graph showing the effect of Sildenafil 100 mg versus placebo on systolic blood pressure (mmHg) over 24 hours post dose. The x-axis measures time post dose in hours, and the y-axis shows changes in systolic blood pressure. Two lines represent Sildenafil and placebo responses over the time course.*
FDA Label Image

10 (Sildenafil Tablets 25 50 100 3)

10 (Sildenafil Tablets 25 50 100 3)
A line graph comparing the change in systolic blood pressure (SBP) over 8 hours post-dose for Doxazosin combined with Placebo versus Doxazosin combined with Sildenafil 25 mg. The y-axis represents change in SBP (mmHg) and the x-axis represents time in hours post-dose.*
FDA Label Image

10 (Sildenafil Tablets 25 50 100 4)

10 (Sildenafil Tablets 25 50 100 4)
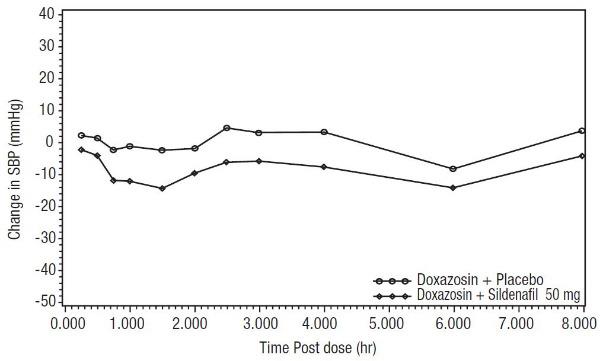
A line graph depicting the change in systolic blood pressure (SBP) in mmHg over time in hours post-dose. The graph compares two groups: one receiving Doxazosin plus Placebo, and the other receiving Doxazosin plus Sildenafil 50 mg, showing variations in blood pressure changes over an 8-hour period.*
FDA Label Image

10 (Sildenafil Tablets 25 50 100 5)

10 (Sildenafil Tablets 25 50 100 5)
A line graph showing blood pressure changes (mmHg) over 8 hours after dosing, comparing Doxazosin combined with Sildenafil 100 mg versus Doxazosin with placebo. The x-axis represents time after dosing in hours, and the y-axis shows blood pressure variation in mmHg. Two lines depict the differences between the two treatments over time.*
FDA Label Image

10 (Sildenafil Tablets 25 50 100 6)

10 (Sildenafil Tablets 25 50 100 6)
A line graph showing plasma concentrations (ng/ml) over time (hours) post dose. The graph depicts the pharmacokinetic profile of a commercial tablet treatment, with plasma concentration rising sharply to a peak around 1-2 hours and then gradually declining over 24 hours.*
FDA Label Image

10 (Sildenafil Tablets 25 50 100 7)

10 (Sildenafil Tablets 25 50 100 7)
A bar chart depicting the effect of sildenafil on maintenance of erection by baseline score. The x-axis shows baseline scores ranging from 0 to 5, and the y-axis represents the percentage of patients at the endpoint, ranging from 0 to 80%. Different bars represent scores from 0 to 5, illustrating variations in patient outcomes at each baseline score.*
FDA Label Image

10 (Sildenafil Tablets 25 50 100 8)

10 (Sildenafil Tablets 25 50 100 8)
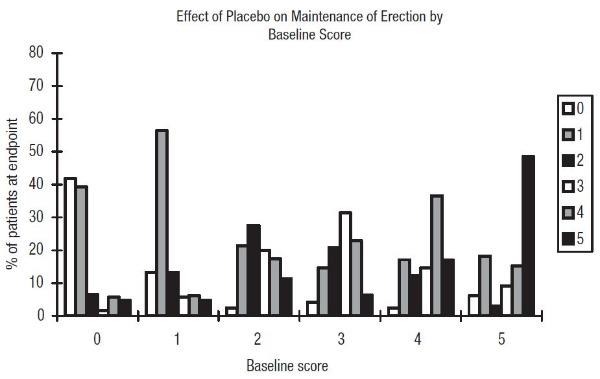
A bar chart titled 'Effect of Placebo on Maintenance of Erection by Baseline Score' showing the percentage of patients at endpoint on the vertical axis and baseline score on the horizontal axis, ranging from 0 to 5. Multiple bars per baseline score category represent different subgroups or scores, illustrating the distribution of patient percentages across these groups under placebo treatment.*
FDA Label Image

10 (Sildenafil Tablets 25 50 100 9)

10 (Sildenafil Tablets 25 50 100 9)
A bar graph showing the percentage of patients reporting improvement across treatment groups: Placebo (24%), Sildenafil 25 mg (63%), Sildenafil 50 mg (74%), and Sildenafil 100 mg (82%). The x-axis lists treatment groups with sample sizes; the y-axis shows percentage improvement. Overall treatment p-value is less than 0.0001.*

* About these descriptions: Image descriptions on this page are generated by automated AI analysis of the product label images from the manufacturer's FDA label submission (SPL). They are provided for reference only and may contain errors or omissions. Always rely on the printed label itself and the official FDA labeling, and consult a pharmacist or healthcare professional with any questions about this product.