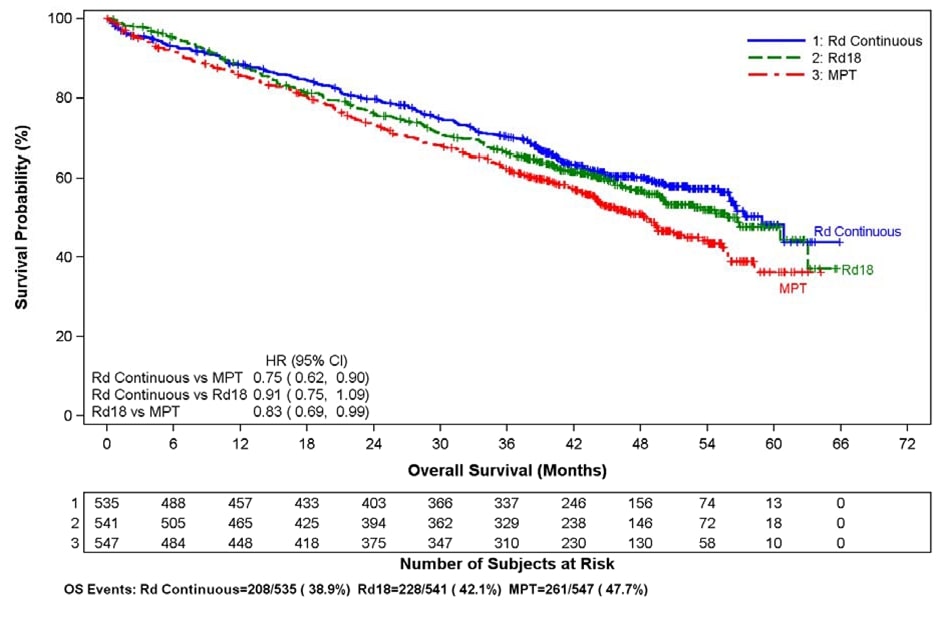
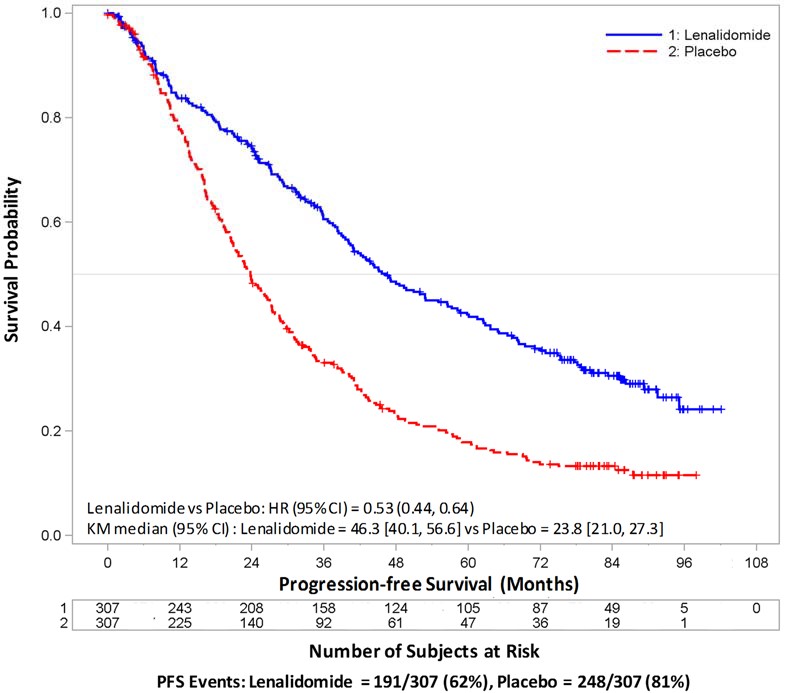
Figure1.jpg (Figure1)
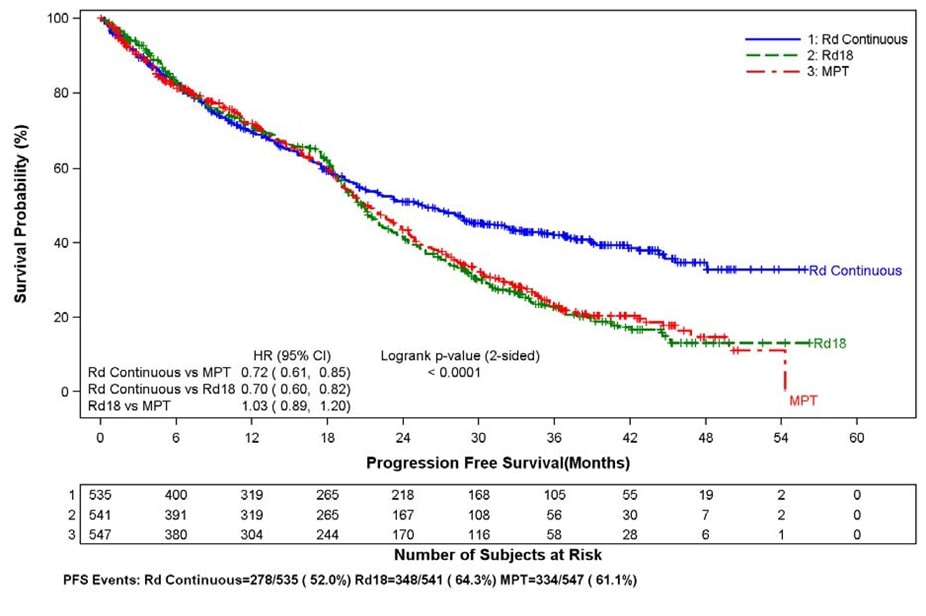
This is a survival analysis of three groups: Rd Continuous, Rd18, and MPT. The graph shows the progression-free survival (in months) on the x-axis and the survival probability percentage on the y-axis. The survival probability is shown for each group at different time points. The table below shows the hazard ratio (HR) with 95% confidence interval (CI) and the logrank p-value (2-sided) for each comparison between groups. The number of subjects at risk and PFS events are also provided.*