Pemetrexed
Product Images NDC 60505-6068

12 FDA label images from Apotex Corp · Packaging, Regulatory Labels, and Product Appearance

Product Visual Gallery

This gallery contains 12 technical images submitted to the FDA as part of the official labeling for Pemetrexed (NDC 60505-6068). Unlike standard consumer photos, these assets often include clinical data figures, molecular chemical structures, and official manufacturer packaging layouts.

As provided by Apotex Corp, these visuals offer a comprehensive scientific overview of the product's physical and chemical identity, aiding pharmacists and researchers in product verification and study.

FDA Label Image

Figure1 (Figure1)

Figure1 (Figure1)
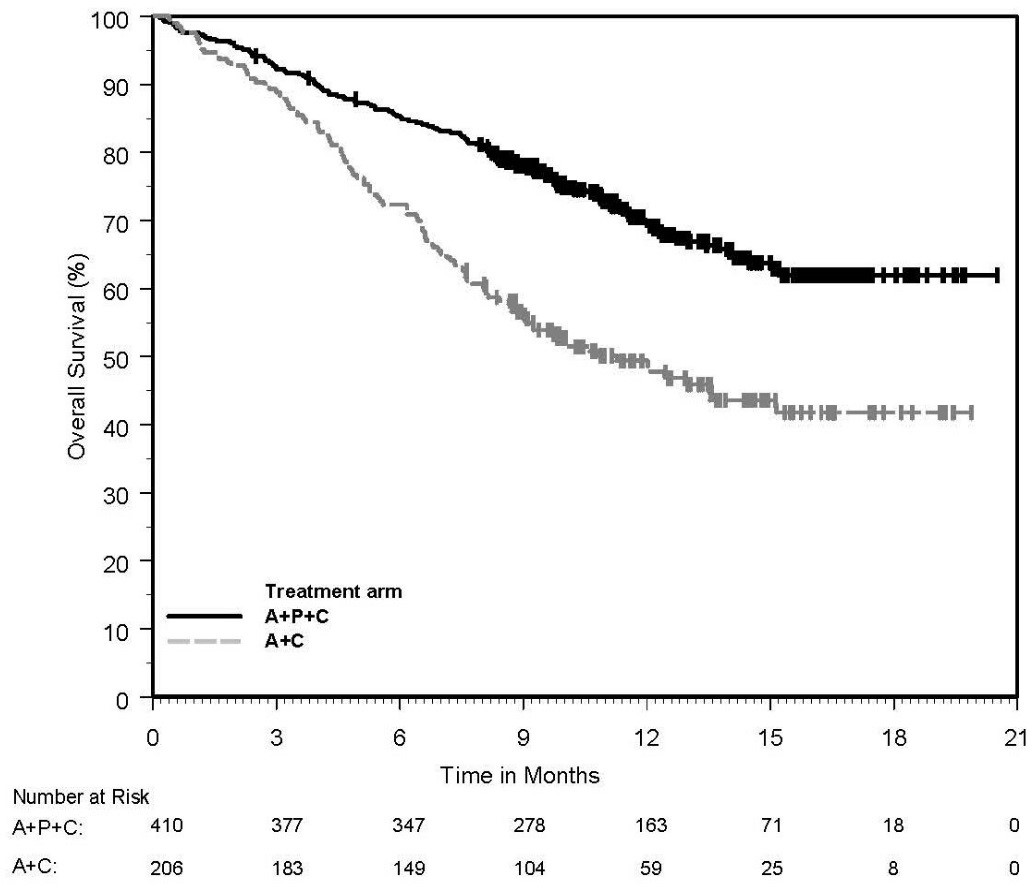
A survival curve chart showing overall survival percentage over time in months for two treatment arms: A+P+C (black solid line) and A+C (gray dashed line). The graph includes a table below indicating the number of patients at risk for each treatment arm at various time points up to 21 months.*
FDA Label Image

Figure2 (Figure2)

Figure2 (Figure2)
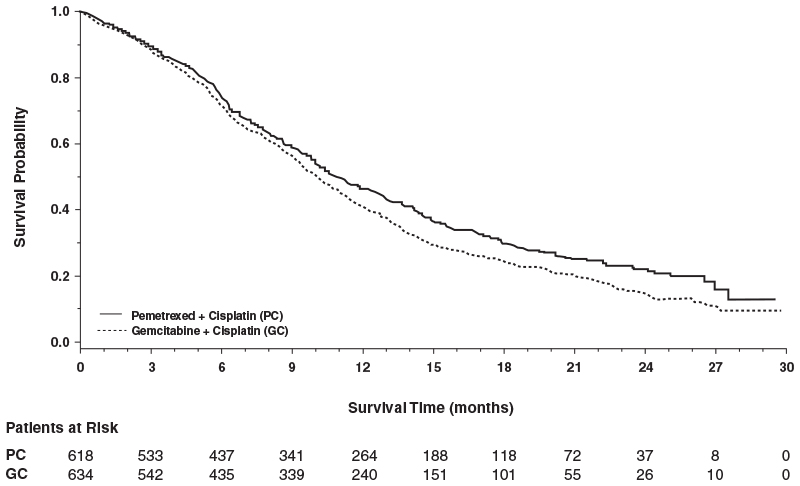
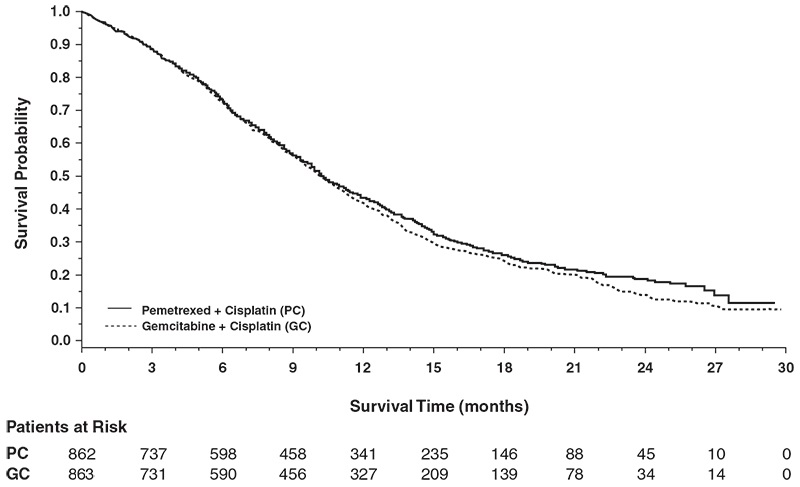
A survival probability chart comparing two treatment groups: Pemetrexed plus Cisplatin (PC) and Gemcitabine plus Cisplatin (GC) over a survival time of 0 to 30 months. The y-axis represents survival probability ranging from 0 to 1. Patient numbers at risk are listed below the graph for both groups at multiple time points.*
FDA Label Image

Figure3 (Figure3)

Figure3 (Figure3)
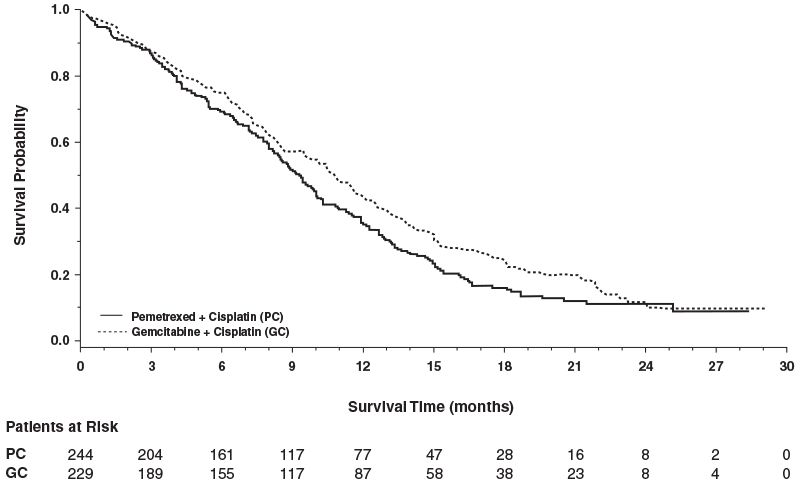
A Kaplan-Meier survival curve comparing survival probability over time (0 to 30 months) between two treatment groups: Pemetrexed + Cisplatin (PC) shown with a solid line, and Gemcitabine + Cisplatin (GC) shown with a dotted line. Patient counts at risk are listed below the x-axis for each group at multiple time points.*
FDA Label Image

Figure4 (Figure4)

Figure4 (Figure4)
A survival probability curve comparing Pemetrexed + Cisplatin (solid line) versus Gemcitabine + Cisplatin (dotted line) over a 30-month period. The x-axis represents survival time in months, and the y-axis shows survival probability. A table below the graph displays the number of patients at risk over time for both treatment groups.*
FDA Label Image

Figure5 (Figure5)

Figure5 (Figure5)
A Kaplan-Meier survival curve chart comparing survival probability over time (months) between Pemetrexed and placebo groups. The chart includes a survival probability y-axis (0 to 1) and a time x-axis (0 to 42 months) with corresponding patients at risk numbers listed below the graph for both groups.*
FDA Label Image

Figure6 (Figure6)

Figure6 (Figure6)
A Kaplan-Meier survival curve chart showing survival probability over time in months comparing Pemetrexed treatment and placebo. The chart includes survival probability on the y-axis, ranging from 0 to 1, and survival time in months on the x-axis, up to 42 months. Pemetrexed is represented by a solid line, showing higher survival probability throughout the period, while placebo is indicated by a dotted line with lower survival rates. Below the graph, a table lists the number of patients at risk over time for both treatment groups.*
FDA Label Image

Figure7 (Figure7)

Figure7 (Figure7)
A survival probability curve chart comparing Pemetrexed and Placebo over time in months. The x-axis represents survival time (months) from 0 to 42, and the y-axis shows survival probability from 0.0 to 1.0. The lower section lists patients at risk for each time interval for both groups.*
FDA Label Image

Figure8 (Figure8)

Figure8 (Figure8)
A survival probability Kaplan-Meier curve comparing Pemetrexed and placebo over a 36-month period. The x-axis represents survival time in months, and the y-axis shows survival probability from 0 to 1. The chart includes a patients-at-risk table below, showing the number of patients remaining in each group at multiple time points.*
FDA Label Image

Figure9 (Figure9)

Figure9 (Figure9)
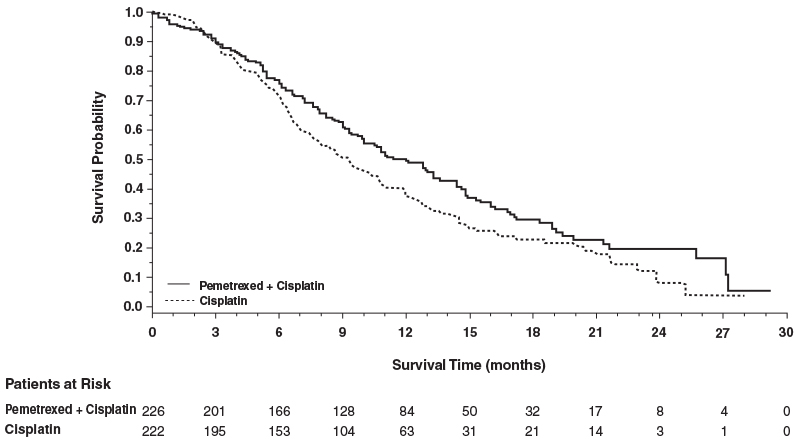
A survival probability Kaplan-Meier curve comparing Pemetrexed plus Cisplatin versus Cisplatin alone over survival time in months. The chart includes a legend distinguishing the two treatment groups and a table below indicating the number of patients at risk for each group at various time points throughout the study.*
FDA Label Image

Pemetrexed-750mg-carton (Pemetrexed 750mg Carton)

Pemetrexed-750mg-carton (Pemetrexed 750mg Carton)
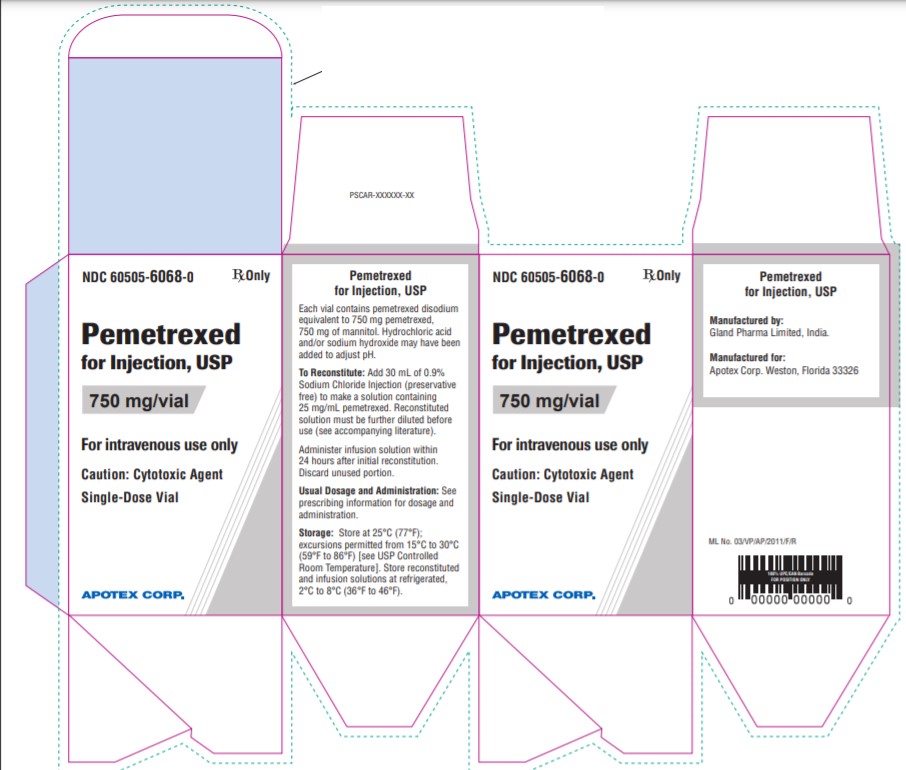
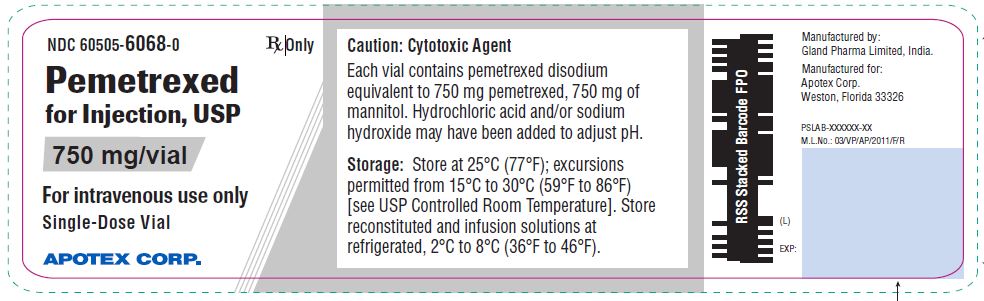
Packaging label for Pemetrexed for Injection, USP, 750 mg per vial, manufactured by Apotex Corp. The label includes dosing and storage information, cautions that it is for intravenous use only and is a cytotoxic agent, and indicates it is a single-dose vial. The product is prepared by Gland Pharma Limited, India, and distributed by Apotex Corp, Weston, Florida.*
FDA Label Image

Pemetrexed-750mg-vial (Pemetrexed 750mg Vial)

Pemetrexed-750mg-vial (Pemetrexed 750mg Vial)
Pemetrexed for Injection, USP 750 mg/vial label from Apotex Corp. This single-dose vial is for intravenous use only and contains pemetrexed disodium equivalent to 750 mg pemetrexed. The label includes storage instructions, cautioning that it is a cytotoxic agent, with specific temperature guidelines for storage and reconstituted infusion solutions. Manufactured by Gland Pharma Limited, India, for Apotex Corp., Weston, Florida.*
FDA Label Image

Structure (Structure)

Structure (Structure)
Chemical structure of pemetrexed depicted with molecular bonds and functional groups labeled, showing the arrangement of atoms and hydration state with 2.5 water molecules.*

* About these descriptions: Image descriptions on this page are generated by automated AI analysis of the product label images from the manufacturer's FDA label submission (SPL). They are provided for reference only and may contain errors or omissions. Always rely on the printed label itself and the official FDA labeling, and consult a pharmacist or healthcare professional with any questions about this product.