Tofacitinib Tablet, Film Coated
Product Images NDC 60505-6263

View Photos of Packaging, Regulatory Labels, and Product Appearance

Product Visual Gallery

This gallery contains 10 technical images submitted to the FDA as part of the official labeling for Tofacitinib (NDC 60505-6263). Unlike standard consumer photos, these assets often include clinical data figures, molecular chemical structures, and official manufacturer packaging layouts.

As provided by Apotex Corp., these visuals offer a comprehensive scientific overview of the product's physical and chemical identity, aiding pharmacists and researchers in product verification and study.

FDA Label Image

Btl-lbl-10mg-60s.jpg (Btl Lbl 10mg 60s)
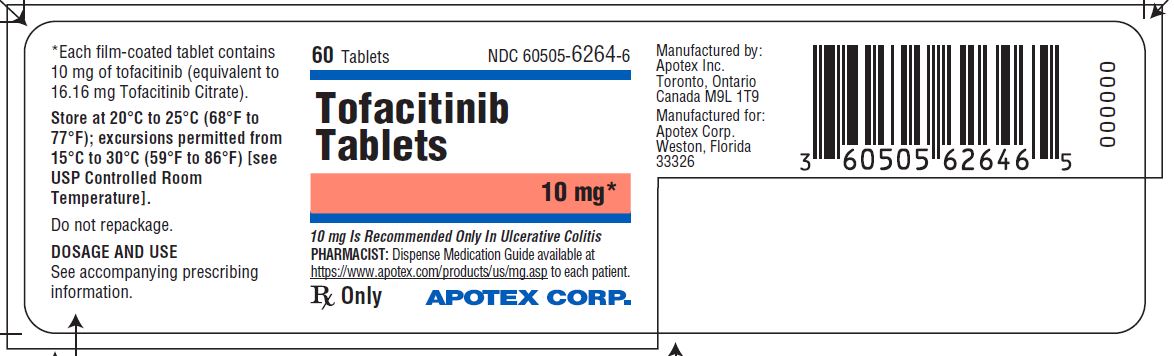
Btl-lbl-10mg-60s.jpg (Btl Lbl 10mg 60s)
Label for Tofacitinib Tablets 10 mg, film-coated oral tablets. The label states each tablet contains 10 mg of tofacitinib and provides storage instructions (20°C to 25°C, excursions allowed from 15°C to 30°C). The package contains 60 tablets and is manufactured by Apotex Inc., Toronto, Ontario, Canada, for Apotex Corp., Weston, Florida. Includes a barcode and a note that 10 mg strength is recommended only for ulcerative colitis.*
FDA Label Image

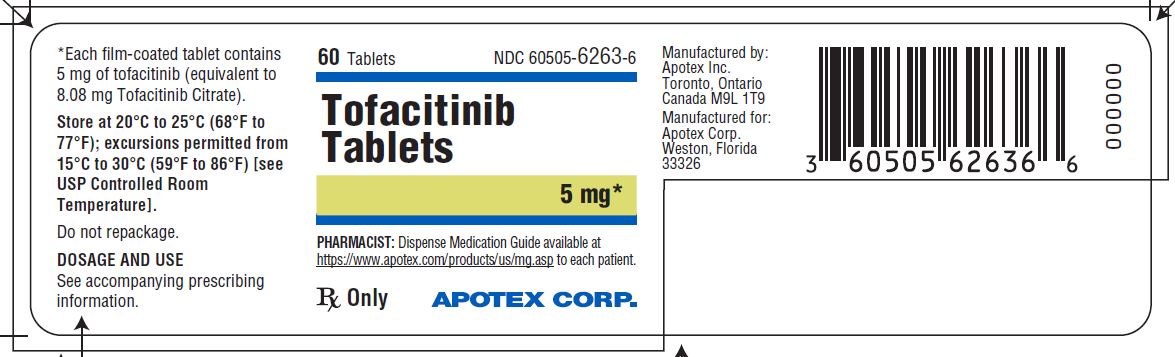
Btl-lbl-5mg-60s.jpg (Btl Lbl 5mg 60s)

Btl-lbl-5mg-60s.jpg (Btl Lbl 5mg 60s)
Label for Tofacitinib Tablets 5 mg, film-coated oral tablets, packaged with 60 tablets. The label indicates Apotex Corp. as the labeler and Apotex Inc. in Toronto, Ontario, Canada as the manufacturer. It includes storage instructions and a reference to dosage information, along with a barcode and NDC 60505-6263-6.*
FDA Label Image

Figure1.jpg (Figure1)

Figure1.jpg (Figure1)
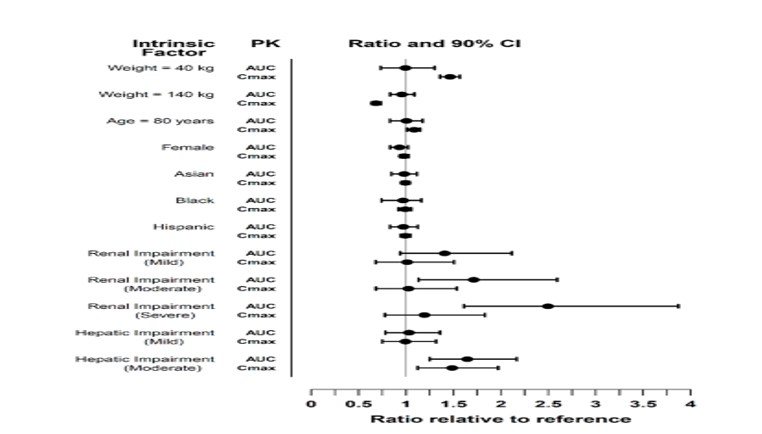
A horizontal error bar chart showing the pharmacokinetic (PK) ratios and 90% confidence intervals for AUC and Cmax across various intrinsic factors such as weight, age, sex, race, and renal and hepatic impairment. The x-axis represents the ratio relative to a reference value from 0 to 4, illustrating comparative PK exposure changes for tofacitinib tablet film coated oral dosage.*
FDA Label Image

Figure2.jpg (Figure2)

Figure2.jpg (Figure2)
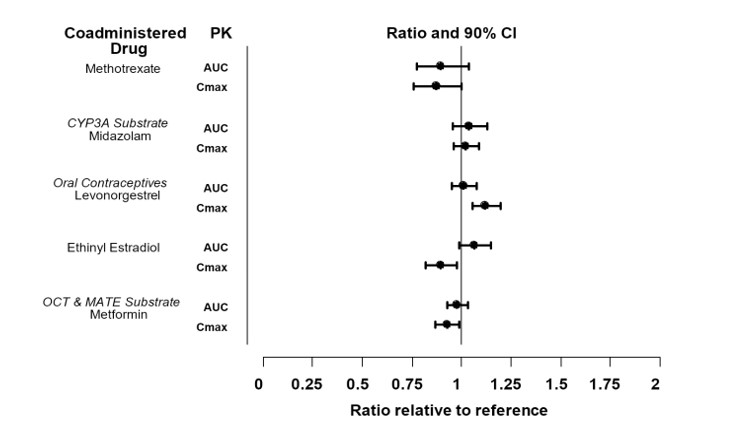
A forest plot showing the pharmacokinetic (PK) ratios and 90% confidence intervals for coadministered drugs with tofacitinib. Drugs listed include Methotrexate, Midazolam, Levonorgestrel, Ethinyl Estradiol, and Metformin, with measurements for AUC and Cmax compared to reference values on a ratio scale from 0 to 2.*
FDA Label Image

Figure3.jpg (Figure3)

Figure3.jpg (Figure3)
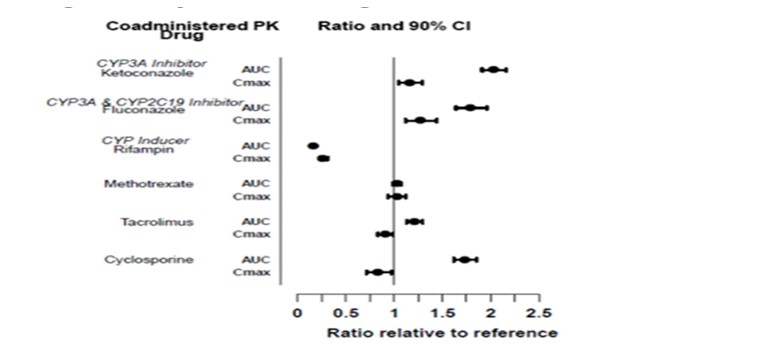
A pharmacokinetic ratio and 90% confidence interval plot showing the effects of coadministered drugs on AUC and Cmax parameters. The chart compares inhibitors and inducers such as ketoconazole, fluconazole, rifampin, methotrexate, tacrolimus, and cyclosporine relative to a reference, with ratios plotted on a horizontal axis from 0 to 2.5.*
FDA Label Image

Figure4.jpg (Figure4)

Figure4.jpg (Figure4)
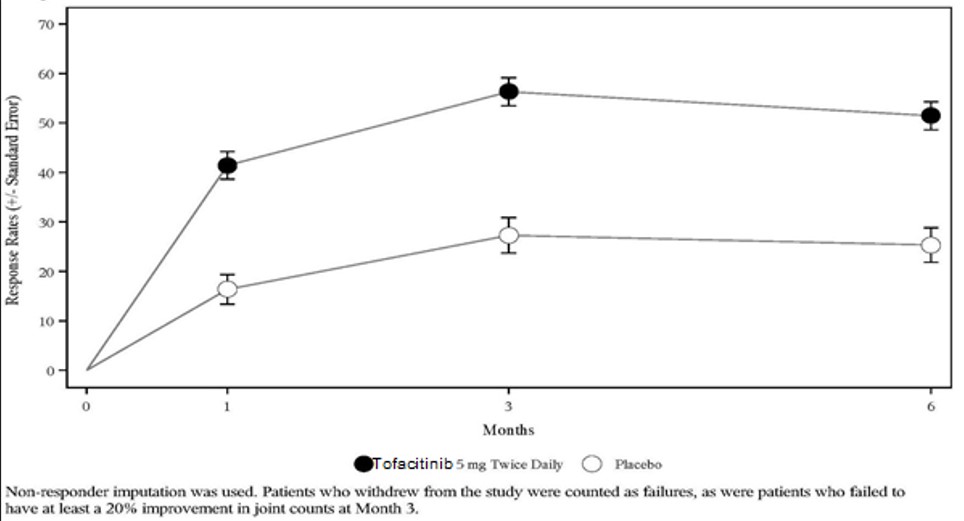
A line graph depicting response rates with standard error over months comparing Tofacitinib 5 mg twice daily and placebo. The X-axis represents months (0, 1, 3, 6) and the Y-axis shows response rates. Two lines illustrate that response rates increase for both groups but are higher for Tofacitinib compared to placebo throughout the study period.*
FDA Label Image

Figure5.jpg (Figure5)

Figure5.jpg (Figure5)
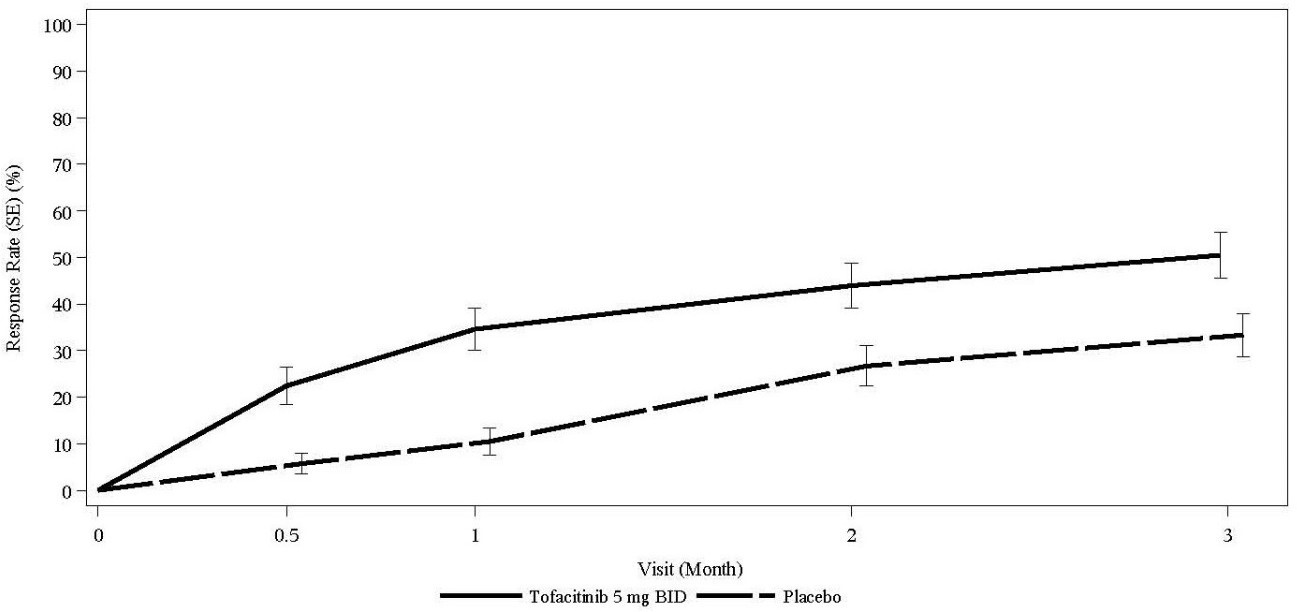
A line graph depicting response rate (percentage with standard error) over months of visit (0 to 3) comparing Tofacitinib 5 mg BID and placebo. The Tofacitinib 5 mg BID group shows a consistently higher response rate increase over time compared to placebo, starting near 0% and reaching above 50% by month 3.*
FDA Label Image

Figure6.jpg (Figure6)

Figure6.jpg (Figure6)
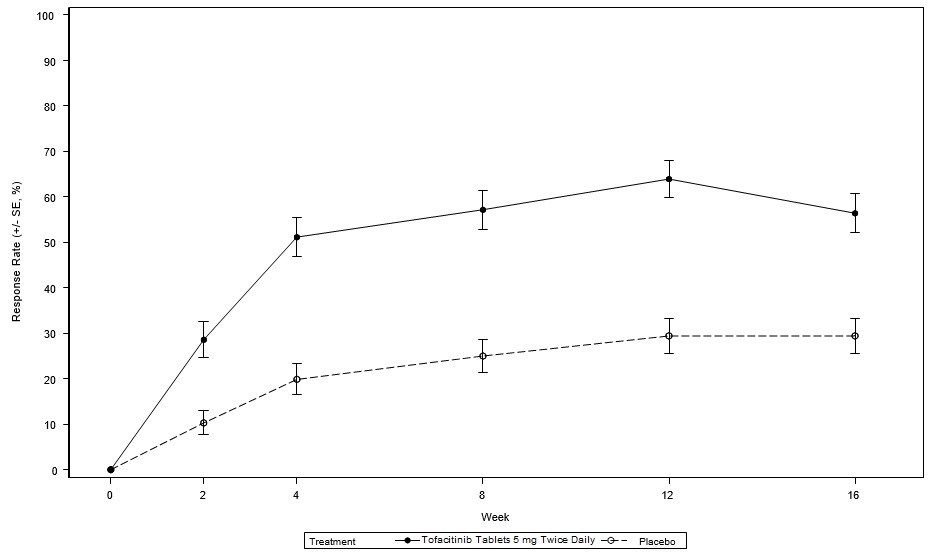
A line graph comparing the response rate percentages over 16 weeks between two treatments: Tofacitinib Tablets 5 mg Twice Daily and placebo. The x-axis represents weeks (0 to 16), and the y-axis shows the response rate percentages with error bars indicating standard error.*
FDA Label Image

Figure7.jpg (Figure7)

Figure7.jpg (Figure7)
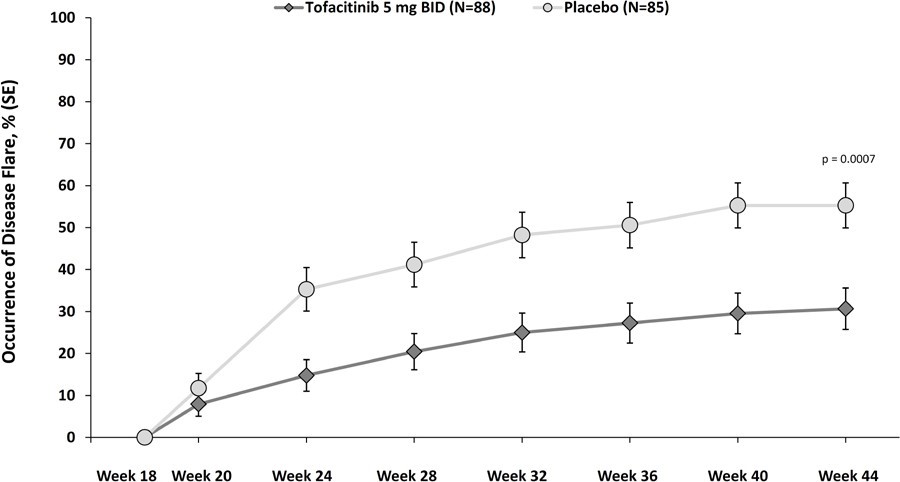
Line chart comparing the occurrence of disease flare over time between tofacitinib 5 mg twice daily and placebo groups. The x-axis shows weeks from 18 to 44, and the y-axis represents the percentage occurrence of disease flare with standard error bars. Two lines depict lower flare rates in the tofacitinib group compared to placebo, with a noted p-value of 0.0007 at week 44.*
FDA Label Image

Structure.jpg (Structure)

Structure.jpg (Structure)
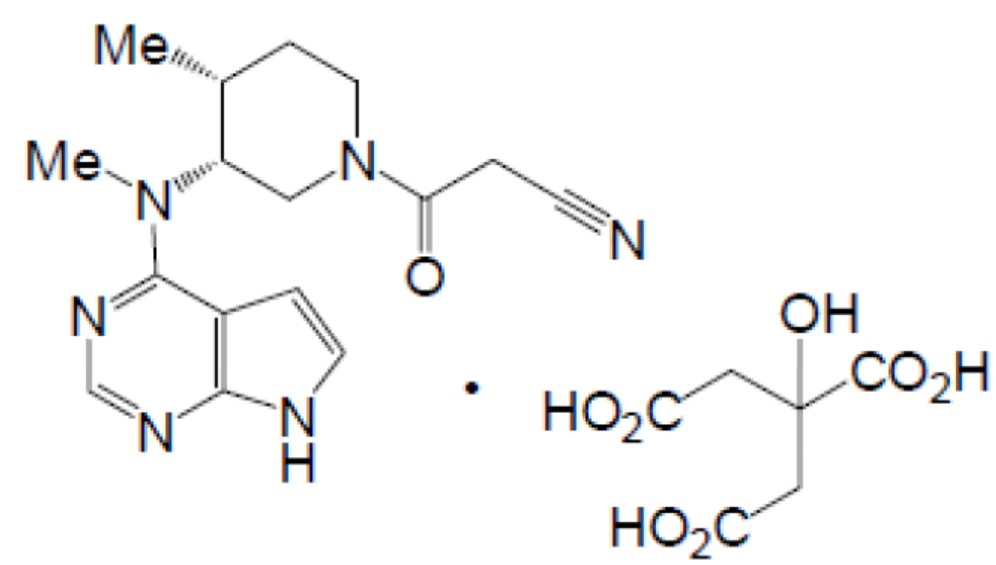
Chemical structure of tofacitinib, the active ingredient in Tofacitinib tablets. The diagram shows the molecular structure with nitrogen (N), oxygen (O), and carbon atoms forming a complex fused ring system and side chains, including carboxylic acid groups.*

* About these descriptions: Image descriptions on this page are generated by automated AI analysis of the product label images from the manufacturer's FDA label submission (SPL). They are provided for reference only and may contain errors or omissions. Always rely on the printed label itself and the official FDA labeling, and consult a pharmacist or healthcare professional with any questions about this product.