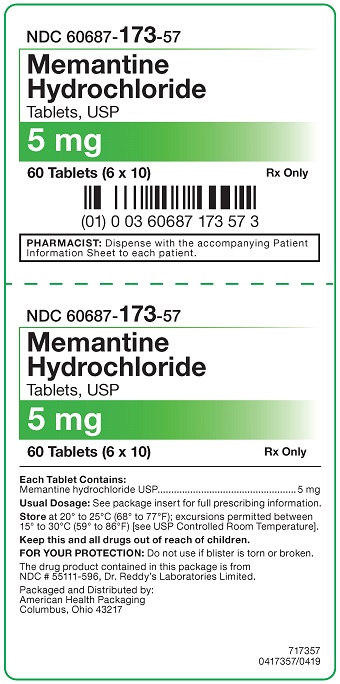
Memantine Tablet
Product Images NDC 60687-173
View Photos of Packaging, Regulatory Labels, and Product Appearance
Product Visual Gallery
This gallery contains 15 technical images submitted to the FDA as part of the official labeling for Memantine (NDC 60687-173). Unlike standard consumer photos, these assets often include clinical data figures, molecular chemical structures, and official manufacturer packaging layouts.
As provided by American Health Packaging, these visuals offer a comprehensive scientific overview of the product's physical and chemical identity, aiding pharmacists and researchers in product verification and study.
Product Images & Figures Index
10 mg Carton
This is a description of a drug named "Memantine Hydrochloride". Each package contains 60 tablets of size 6 x 10. The drug contains 10mg of Hiermantne hyorochiorde USP. The usual dosage information is provided with the package insert. The drug should be stored between 20° to 25°C. The package is distributed by American Geaih Pagaing.*
5 mg Blister
5 mg Carton
The text is a description of a medication called Memantine Hydrochloride in tablet form. The medication comes in a pack of 60 tablets and can only be obtained with a prescription. The pharmacist is advised to dispense the accompanying patient information sheet to each patient. The rest of the text is not readable.*
883dccf8 44b2 5f82 E053 2995a90a12dd
883dccf8 44b3 5f82 E053 2995a90a12dd
Memantine HCl Structural Formula (Image 01 01)
Figure 1: Time Course Of The Change From Baseline In Adcs-adl Score For Patients Completing 28 Weeks Of Treatment. (Image 02 01)
Figure 2: Cumulative Percentage Of Patients Completing 28 Weeks Of Double-blind Treatment With Specified Changes From Baseline In Adcs-adl Scores. (Image 03 01)
Figure 3: Time Course Of The Change From Baseline In Sib Score For Patients Completing 28 Weeks Of Treatment. (Image 04 01)
Figure 4: Cumulative Percentage Of Patients Completing 28 Weeks Of Double-blind Treatment With Specified Changes From Baseline In Sib Scores. (Image 05 01)
Figure 5: Time Course Of The Change From Baseline In Adcs-adl Score For Patients Completing 24 Weeks Of Treatment. (Image 06 01)
Figure 6: Cumulative Percentage Of Patients Completing 24 Weeks Of Double-blind Treatment With Specified Changes From Baseline In Adcs-adl Scores. (Image 07 01)
Figure 7: Time Course Of The Change From Baseline In Sib Score For Patients Completing 24 Weeks Of Treatment. (Image 08 01)
Figure 8: Cumulative Percentage Of Patients Completing 24 Weeks Of Double-blind Treatment With Specified Changes From Baseline In Sib Scores. (Image 09 01)
* These product label images have been analyzed using experimental machine learning. Please verify findings with the primary label text.