Donepezil Tablet
Product Images NDC 60687-303

17 FDA label images from American Health Packaging · Packaging, Regulatory Labels, and Product Appearance

Product Visual Gallery

This gallery contains 17 technical images submitted to the FDA as part of the official labeling for Donepezil (NDC 60687-303). Unlike standard consumer photos, these assets often include clinical data figures, molecular chemical structures, and official manufacturer packaging layouts.

As provided by American Health Packaging, these visuals offer a comprehensive scientific overview of the product's physical and chemical identity, aiding pharmacists and researchers in product verification and study.

FDA Label Image

10 mg Donepezil HCl Tablet Blister 01
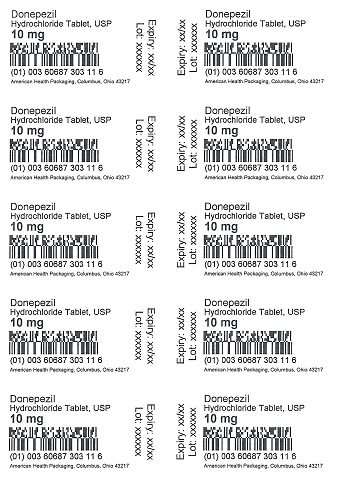
10 mg Donepezil HCl Tablet Blister 01
This image shows multiple label stickers of Donepezil Hydrochloride Tablets, USP 10 mg, for oral use. Each label includes the product name, strength, NDC barcode, expiration date, lot number, and the labeler American Health Packaging in Columbus, Ohio.*
FDA Label Image

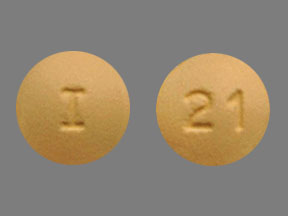
10 mg Donepezil HCl Tablet

10 mg Donepezil HCl Tablet
Donepezil 10 mg oral tablet shown from both sides. One side is imprinted with the letter 'I', and the other side is imprinted with the number '21'. The tablet is round and light brown in color. Labeler is American Health Packaging.*
FDA Label Image

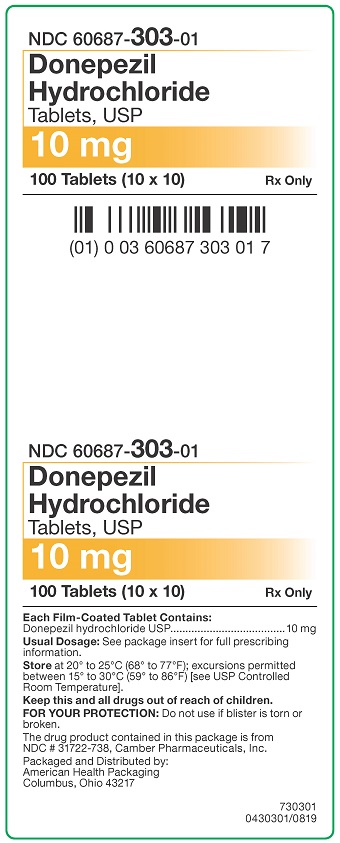
10 mg Donepezil HCl Tablets Carton 01

10 mg Donepezil HCl Tablets Carton 01
Donepezil Hydrochloride 10 mg tablets label from American Health Packaging. The label indicates it contains 100 film-coated tablets (10 x 10) for oral use, marked Rx only. It includes dosage instructions and storage temperature, with a barcode and NDC 60687-303-01.*
FDA Label Image

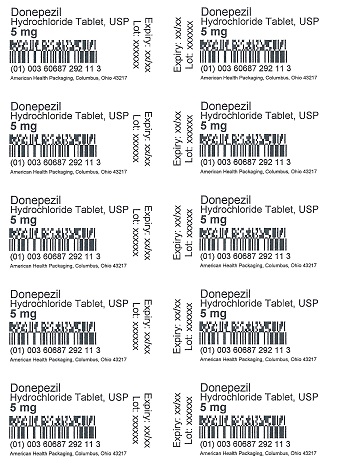
5 mg Donepezil HCl Tablet Blister 01

5 mg Donepezil HCl Tablet Blister 01
Donepezil Hydrochloride Tablet USP 5 mg labels with barcode and lot number placeholders. Each label includes the American Health Packaging name and location, expiration date, and a 2D barcode. Labels are arranged in two columns and five rows on the sheet.*
FDA Label Image

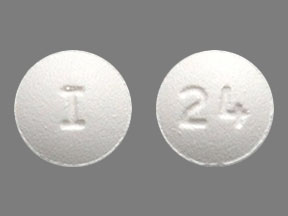
5 mg Donepezil HCl Tablet

5 mg Donepezil HCl Tablet
Donepezil 10 mg tablet, round and white, with imprint '1' on one side and '24' on the other. The tablet is an oral dosage form of Donepezil hydrochloride, labeled by American Health Packaging.*
FDA Label Image

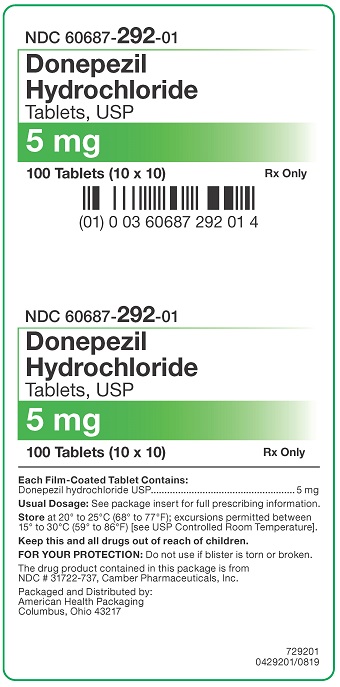
5 mg Donepezil HCl Tablets Carton 01

5 mg Donepezil HCl Tablets Carton 01
Label for Donepezil Hydrochloride oral tablets, USP, 5 mg strength. The package contains 100 tablets (10 bottles of 10 tablets each). Labeler is American Health Packaging. The label includes storage instructions, drug protection warnings, NDC 60687-292-01, and barcode.*
FDA Label Image

Figure5 (Figure 5)

Figure5 (Figure 5)
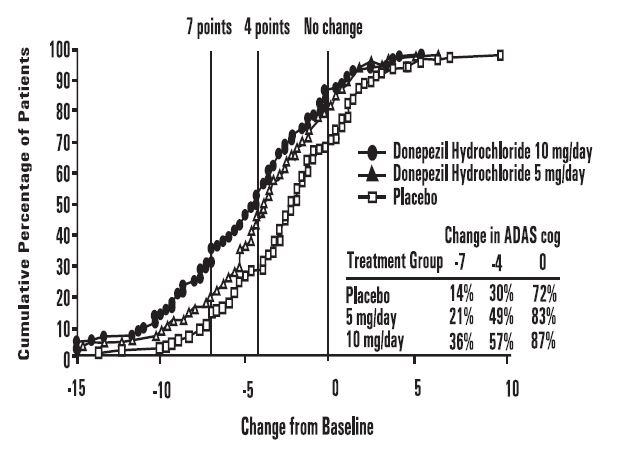
A cumulative percentage of patients graph comparing Donepezil Hydrochloride 10 mg/day, 5 mg/day, and placebo. The x-axis shows change from baseline, and the y-axis shows cumulative percentage of patients. The graph includes annotations for changes of 7 points, 4 points, and no change, along with a small data table summarizing patient percentages within treatment groups for different changes in ADAS cognitive scores.*
FDA Label Image

Figure6 (Figure 6)

Figure6 (Figure 6)
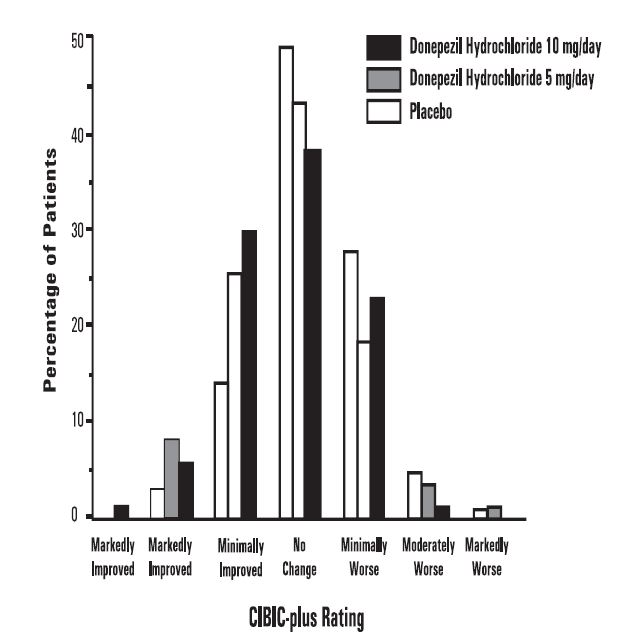
A bar chart depicting the percentage of patients by CIBIC-plus rating categories for three groups: Donepezil Hydrochloride 10 mg/day, Donepezil Hydrochloride 5 mg/day, and placebo. The ratings range from Markedly Improved to Markedly Worse, showing relative patient outcomes across treatment and placebo groups.*
FDA Label Image

Figure7 (Figure 7)

Figure7 (Figure 7)
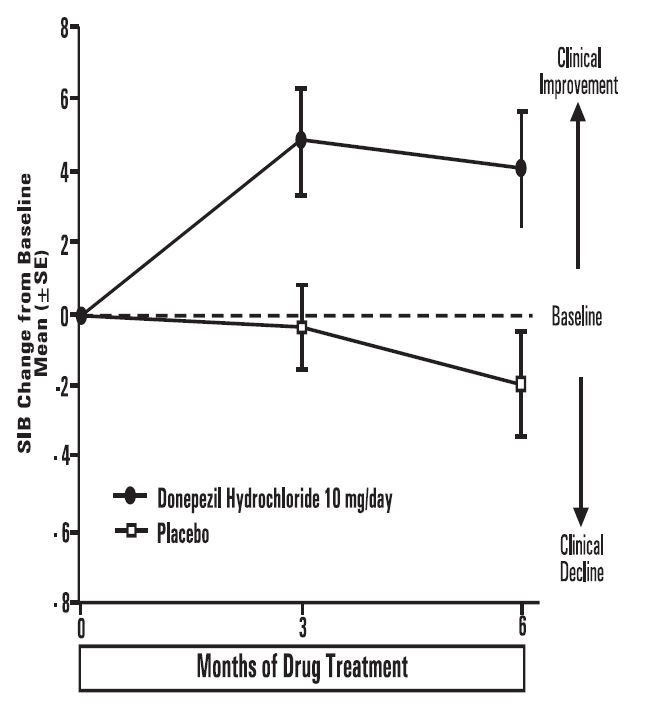
A line graph depicting SIB (Severe Impairment Battery) change from baseline mean (± SE) over 0, 3, and 6 months of drug treatment. The graph compares Donepezil Hydrochloride 10 mg/day and placebo groups, showing an upward trend for Donepezil indicative of clinical improvement, and a downward trend for placebo indicating clinical decline. The vertical axis ranges from -8 to 8, and the horizontal axis measures months of treatment.*
FDA Label Image

Figure 8

Figure 8
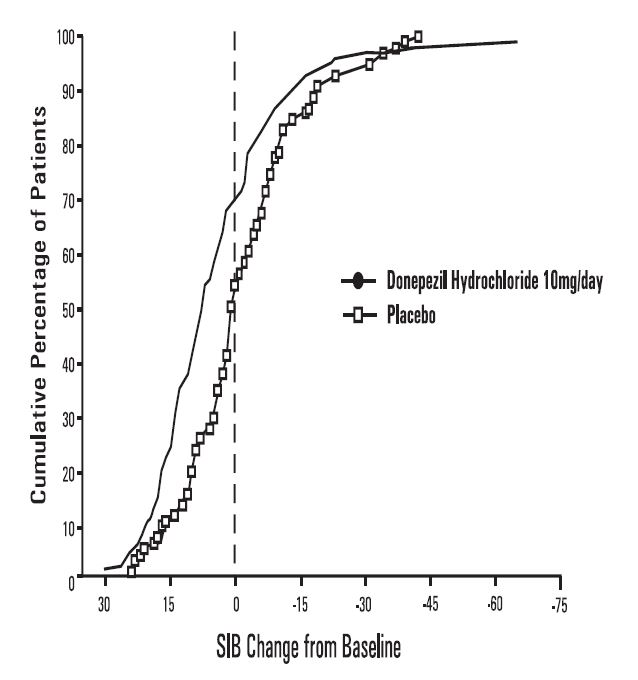
A cumulative percentage of patients graph comparing Donepezil Hydrochloride 10 mg/day and placebo groups, showing SIB (Severe Impairment Battery) change from baseline on the x-axis and cumulative percentage of patients on the y-axis. The graph illustrates two curves, with Donepezil Hydrochloride showing a more favorable change distribution than placebo.*
FDA Label Image

Image 01

Image 01
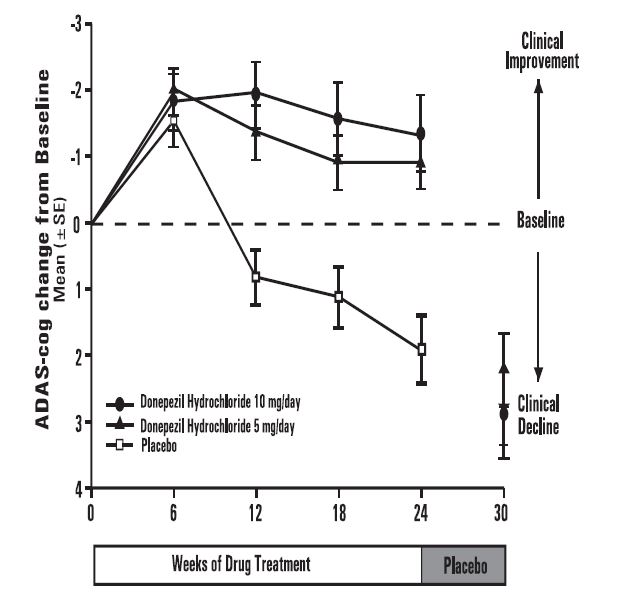
Line graph depicting ADAS-cog change from baseline over 30 weeks of drug treatment showing mean values with standard error. The graph compares Donepezil Hydrochloride 10 mg/day, 5 mg/day, and placebo groups, illustrating clinical improvement and decline relative to baseline.*
FDA Label Image

Image 02

Image 02
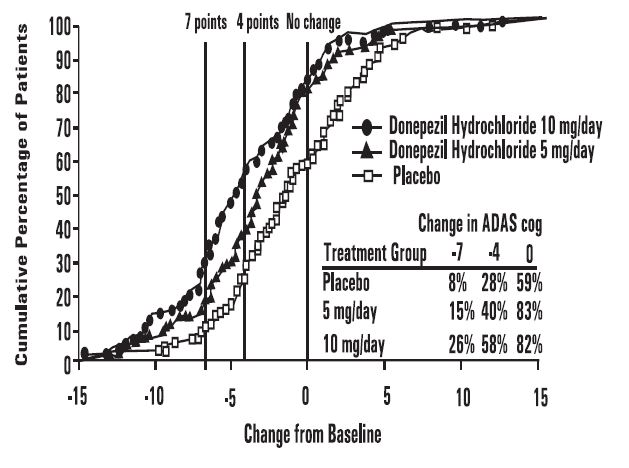
A cumulative percentage line graph depicting patient response to Donepezil Hydrochloride at 5 mg/day and 10 mg/day doses compared to placebo. The X-axis shows change from baseline in ADAS-cog scores, and the Y-axis shows cumulative percentage of patients. The graph includes a small table summarizing percentages of patients achieving specific change values (-7, -4, 0) in each treatment group.*
FDA Label Image

Image 03

Image 03
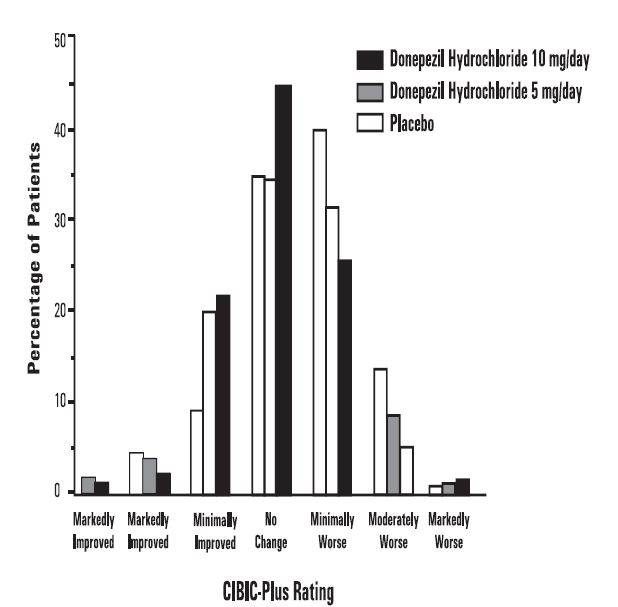
A bar graph depicting the CIBIC-Plus Rating distribution by percentage of patients for Donepezil hydrochloride 10 mg/day, 5 mg/day, and placebo groups. The categories on the x-axis range from Markedly Improved to Markedly Worse, with the y-axis showing percentage of patients. The 10 mg/day group shows the highest percentage in the No Change category compared to other groups.*
FDA Label Image

Image 04

Image 04
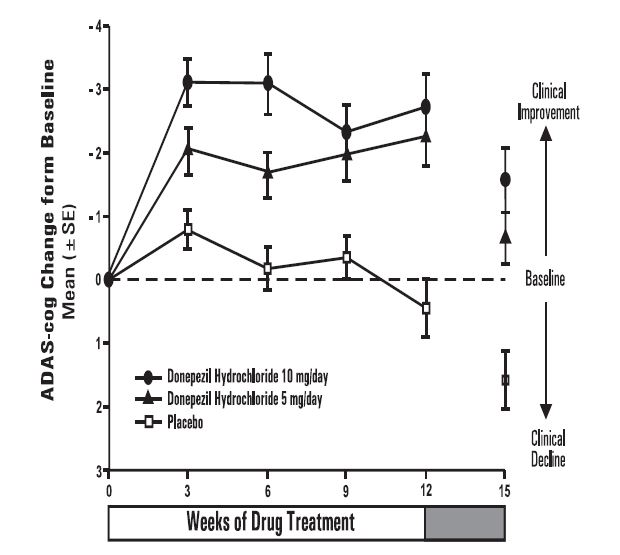
A line graph showing the ADAS-cog change from baseline (mean ± SE) over weeks of drug treatment up to 12 weeks. It compares Donepezil Hydrochloride 10 mg/day, Donepezil Hydrochloride 5 mg/day, and placebo. The y-axis ranges from clinical improvement to clinical decline, with baseline marked at zero change. Both Donepezil doses show trends toward clinical improvement compared to placebo.*
FDA Label Image

Image 05

Image 05
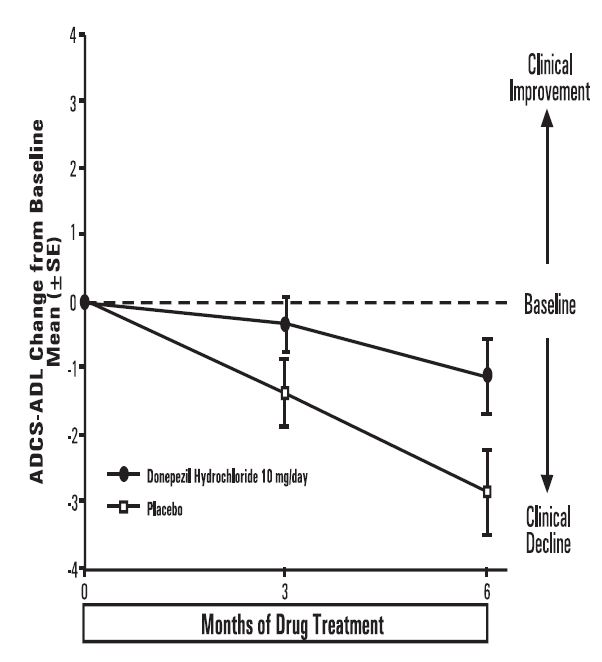
A line graph showing ADCS-ADL change from baseline over 6 months of drug treatment comparing Donepezil Hydrochloride 10 mg/day and placebo. The y-axis ranges from clinical improvement to clinical decline, with the baseline marked at zero. Donepezil shows less decline over time compared to placebo, with data points at 0, 3, and 6 months including error bars for each group.*
FDA Label Image

Image 06

Image 06
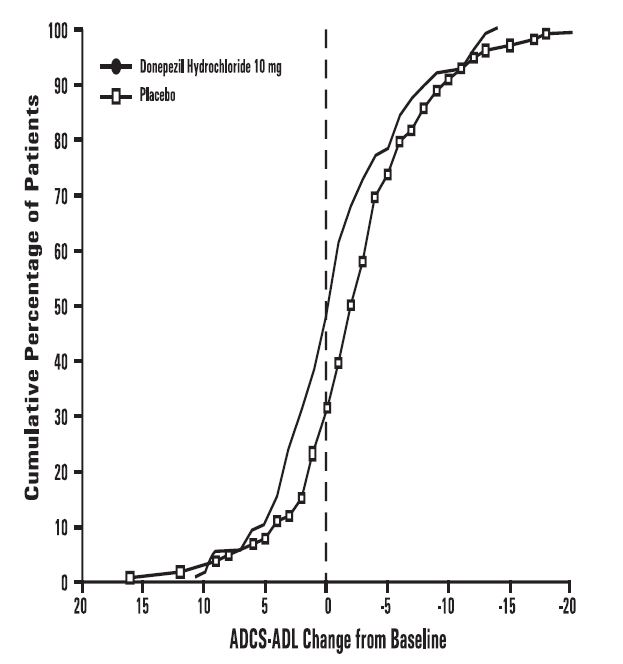
A cumulative percentage of patients graph comparing Donepezil Hydrochloride 10 mg to placebo. The x-axis shows the ADCS-ADL change from baseline, ranging from 20 to -20, and the y-axis shows the cumulative percentage of patients from 0 to 100 percent. The graph has two lines: one for Donepezil Hydrochloride 10 mg represented by filled circles, and one for placebo represented by open squares, illustrating patient distribution based on ADCS-ADL changes.*
FDA Label Image

Structure (Structure)

Structure (Structure)
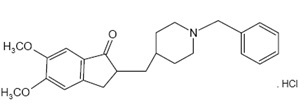
Chemical structure of Donepezil hydrochloride showing the molecular arrangement including methoxy groups, a piperidine ring, and a benzyl group, with the associated hydrochloride component.*

* About these descriptions: Image descriptions on this page are generated by automated AI analysis of the product label images from the manufacturer's FDA label submission (SPL). They are provided for reference only and may contain errors or omissions. Always rely on the printed label itself and the official FDA labeling, and consult a pharmacist or healthcare professional with any questions about this product.