Desvenlafaxine Tablet, Film Coated, Extended Release
Product Images NDC 60687-607

9 FDA label images from American Health Packaging · Packaging, Regulatory Labels, and Product Appearance

Product Visual Gallery

This gallery contains 9 technical images submitted to the FDA as part of the official labeling for Desvenlafaxine (NDC 60687-607). Unlike standard consumer photos, these assets often include clinical data figures, molecular chemical structures, and official manufacturer packaging layouts.

As provided by American Health Packaging, these visuals offer a comprehensive scientific overview of the product's physical and chemical identity, aiding pharmacists and researchers in product verification and study.

FDA Label Image

Ahp60721

Ahp60721
Desvenlafaxine 50 mg extended-release film-coated oral tablet, round and light beige in color. One side is imprinted with the code '54 716', and the other side is plain without markings. Manufactured by American Health Packaging.*
FDA Label Image

50 mg Desvenlafaxine Extended-release Tablet Blister (Blister)

50 mg Desvenlafaxine Extended-release Tablet Blister (Blister)
Desvenlafaxine extended-release 50 mg oral tablets film-coated, labeled by American Health Packaging. The image shows multiple identical labels featuring the product name, strength, extended-release tablet form, and barcodes with space for lot number and expiry date details.*
FDA Label Image

50 mg Desvenlafaxine Extended-release Tablets Carton (Carton)

50 mg Desvenlafaxine Extended-release Tablets Carton (Carton)
Label for Desvenlafaxine Extended-Release Tablets, 50 mg strength, oral dosage form. The label shows a package containing 30 tablets (3 blister packs of 10). Labeler is American Health Packaging. Includes directions for use, storage conditions, and a pharmacy note about dispensing with the medication guide. The NDC is 60687-607-21.*
FDA Label Image

Figure 1: Impact Of Intrinsic Factors (renal, Hepatic Impairment And Population Description) On Desvenlafaxine Pharmacokinetics (Figure 1)

Figure 1: Impact Of Intrinsic Factors (renal, Hepatic Impairment And Population Description) On Desvenlafaxine Pharmacokinetics (Figure 1)
A horizontal forest plot chart illustrating the geometric mean ratios (90% confidence intervals) for Cmax and AUC pharmacokinetic parameters relative to reference values. The chart compares these parameters across categories of renal impairment (mild, moderate, severe, ESRD), hepatic impairment (mild, moderate, severe), and population descriptions by gender and age group (females, ages 65-75, and >75 years). The x-axis represents change relative to reference from 0.5 to 3.5.*
FDA Label Image

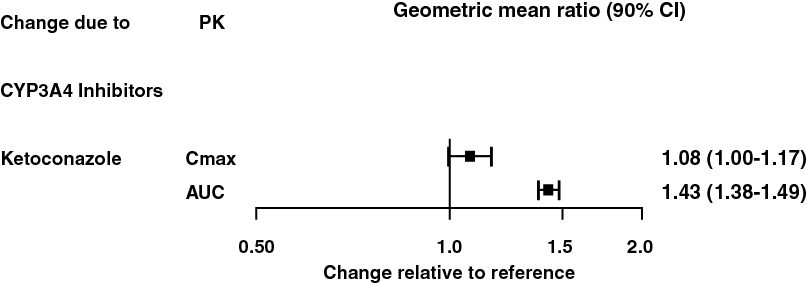
Figure 2: Effect Of Other Drugs On Desvenlafaxine Pharmacokinetics (Figure 2)

Figure 2: Effect Of Other Drugs On Desvenlafaxine Pharmacokinetics (Figure 2)
A pharmacokinetic chart showing geometric mean ratios with 90% confidence intervals for Cmax and AUC of Desvenlafaxine when co-administered with the CYP3A4 inhibitor ketoconazole. The horizontal axis represents change relative to reference, ranging from 0.5 to 2.0, with data points near 1.08 for Cmax and 1.43 for AUC.*
FDA Label Image

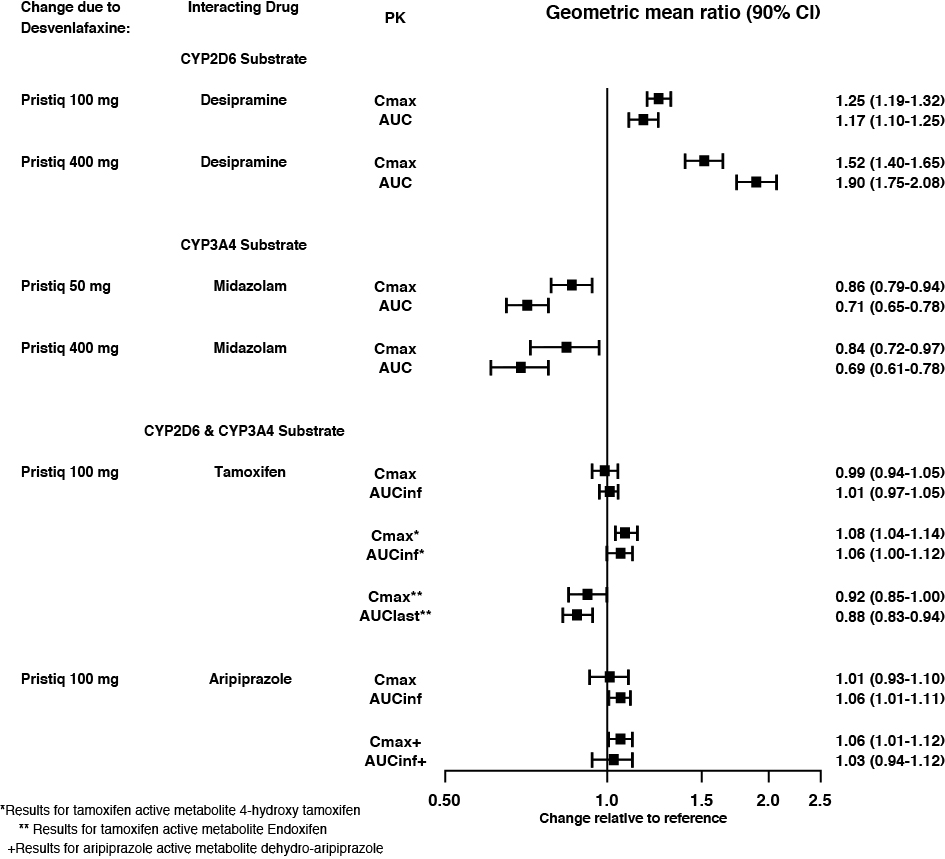
Figure 3: Effects Of Desvenlafaxine On Pharmacokinetics Of Other Drugs (Figure 3)

Figure 3: Effects Of Desvenlafaxine On Pharmacokinetics Of Other Drugs (Figure 3)
A forest plot chart showing geometric mean ratios (90% confidence intervals) for pharmacokinetic parameters (Cmax, AUC, AUCinf, AUClast) of interacting drugs (Desipramine, Midazolam, Tamoxifen, Aripiprazole) with Desvenlafaxine (Pristiq) at various doses (50 mg, 100 mg, 400 mg). The x-axis shows change relative to reference from 0.5 to 2.5.*
FDA Label Image

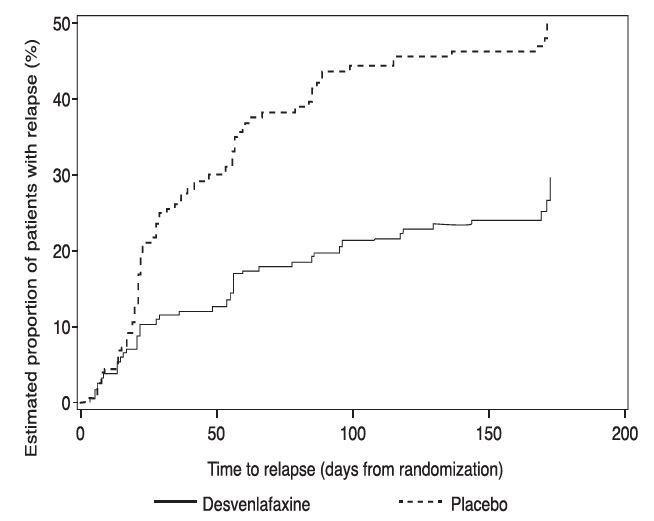
Figure 4: Estimated Proportion Of Relapses Vs. Number Of Days Since Randomization (study 5) (Figure 4)

Figure 4: Estimated Proportion Of Relapses Vs. Number Of Days Since Randomization (study 5) (Figure 4)
A Kaplan-Meier curve chart comparing the estimated proportion of patients with relapse (%) over time (days from randomization) for Desvenlafaxine 50 mg (solid line) versus Placebo (dashed line). The chart shows relapse percentages increasing up to roughly 30% for placebo and about 15% for Desvenlafaxine over approximately 190 days.*
FDA Label Image

Figure 5: Estimated Proportion Of Relapses Vs. Number Of Days Since Randomization (study 6) (Figure 5)

Figure 5: Estimated Proportion Of Relapses Vs. Number Of Days Since Randomization (study 6) (Figure 5)
A Kaplan-Meier curve graph depicting the estimated proportion of patients with relapse (%) over time (days from randomization) comparing Desvenlafaxine versus Placebo. The solid line represents Desvenlafaxine, showing a lower relapse rate over approximately 180 days, while the dashed line represents Placebo with a higher relapse proportion.*
FDA Label Image

Structural Formula (Structure)

Structural Formula (Structure)
Chemical structure of desvenlafaxine showing its molecular components including hydroxyphenyl, cyclohexanol, and dimethylamino groups, alongside oxalic acid and a water molecule.*

* About these descriptions: Image descriptions on this page are generated by automated AI analysis of the product label images from the manufacturer's FDA label submission (SPL). They are provided for reference only and may contain errors or omissions. Always rely on the printed label itself and the official FDA labeling, and consult a pharmacist or healthcare professional with any questions about this product.