Rivastigmine Tartrate Capsule
Product Images NDC 60687-777

View Photos of Packaging, Regulatory Labels, and Product Appearance

Product Visual Gallery

This gallery contains 12 technical images submitted to the FDA as part of the official labeling for Rivastigmine Tartrate (NDC 60687-777). Unlike standard consumer photos, these assets often include clinical data figures, molecular chemical structures, and official manufacturer packaging layouts.

As provided by American Health Packaging, these visuals offer a comprehensive scientific overview of the product's physical and chemical identity, aiding pharmacists and researchers in product verification and study.

FDA Label Image

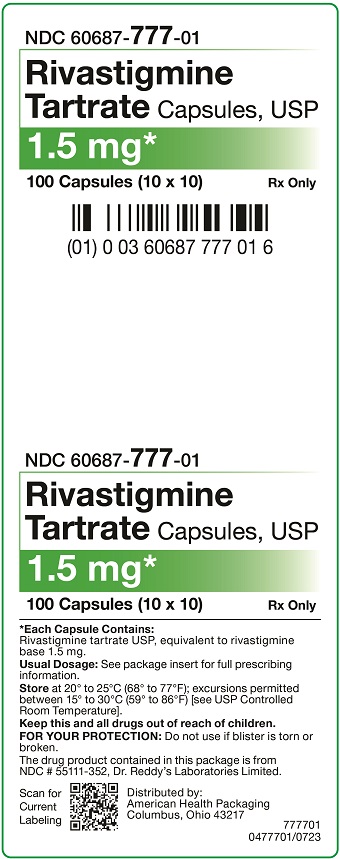
1.5 mg Rivastigmine Tartrate Capsule Blister (1.5 mg Rivastigmine Tartrate Capsule Blister.jpg)
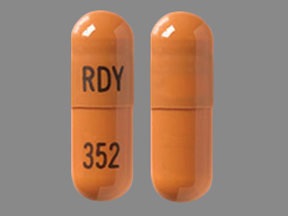
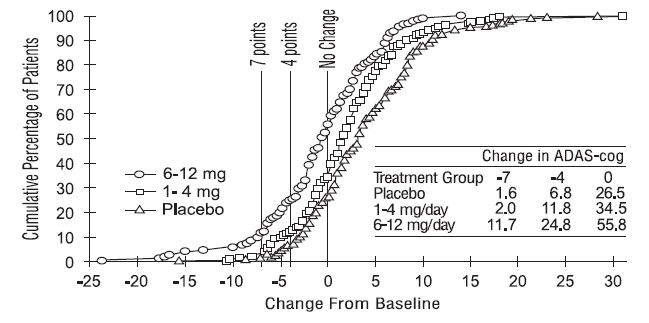
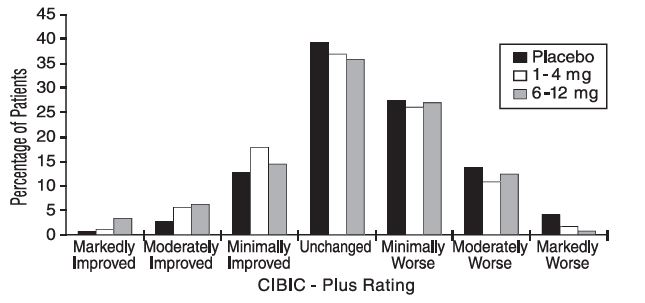
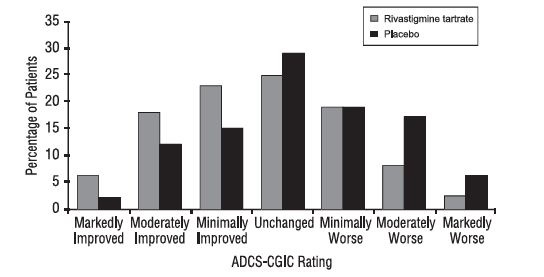
FDA Label Image

1.5 mg Rivastigmine Tartrate Capsules Carton (1.5 mg Rivastigmine Tartrate Capsules Carton.jpg)

FDA Label Image

Ahp77701

FDA Label Image

Figure 1: Time-course Of The Change From Baseline In Adas-cog Score For Patients Completing 26 Weeks Of Treatment In Study 1 (Figure1)

FDA Label Image

Figure 2: Cumulative Percentage Of Patients Completing 26 Weeks Of Double-blind Treatment With Specified Changes From Baseline Adas-cog Scores. The Percentages Of Randomized Patients Who Completed The (Figure2)

FDA Label Image

Figure 3: Frequency Distribution Of Cibic-plus Scores At Week 26 In Study 1 (Figure3)

FDA Label Image

Figure 4: Time-course Of The Change From Baseline In Adas-cog Score For Patients Completing 26 Weeks Of Treatment (Figure4)

FDA Label Image

Figure 5: Cumulative Percentage Of Patients Completing 26 Weeks Of Double-blind Treatment With Specified Changes From Baseline Adas-cog Scores. The Percentages Of Randomized Patients Who Completed The (Figure5)

FDA Label Image

Figure 6: Frequency Distribution Of Cibic-plus Scores At Week 26 In Study 2 (Figure6)

FDA Label Image

Figure 7: Time Course Of The Change From Baseline In Adas-cog Score For Patients Completing 24 Weeks Of Treatment In Study 4 (Figure7)

FDA Label Image

Figure 8: Distribution Of Adcs-cgic Scores For Patients Completing 24 Weeks Of Treatment In Study 4 (Figure8)

FDA Label Image

Structural Formula (Structure 01)