Prasugrel Tablet, Film Coated
Product Images NDC 60687-883

View Photos of Packaging, Regulatory Labels, and Product Appearance

Product Visual Gallery

This gallery contains 9 technical images submitted to the FDA as part of the official labeling for Prasugrel (NDC 60687-883). Unlike standard consumer photos, these assets often include clinical data figures, molecular chemical structures, and official manufacturer packaging layouts.

As provided by American Health Packaging, these visuals offer a comprehensive scientific overview of the product's physical and chemical identity, aiding pharmacists and researchers in product verification and study.

FDA Label Image

10 mg Prasugrel Tablet Blister.jpg (10 mg Prasugrel Tablet Blister)
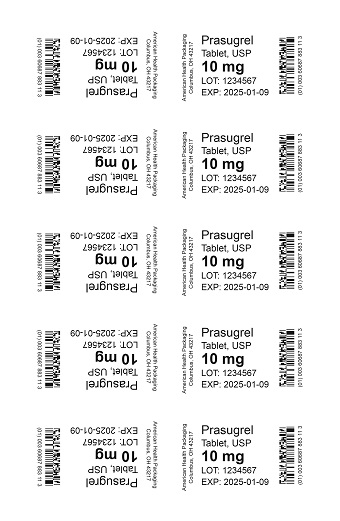
10 mg Prasugrel Tablet Blister.jpg (10 mg Prasugrel Tablet Blister)
Label panel for Prasugrel 10 mg film-coated tablets from American Health Packaging. The label lists the drug name, strength, dosage form, lot number 1234567, and expiration date 2025-01-09. Multiple identical labels are shown in a sheet format with barcodes included.*
FDA Label Image

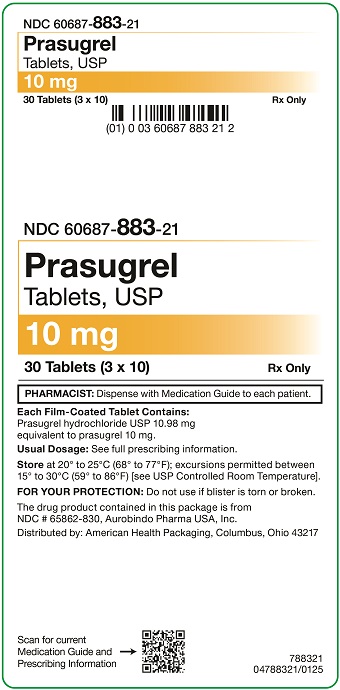
10 mg Prasugrel Tablets Carton.jpg (10 mg Prasugrel Tablets Carton)

10 mg Prasugrel Tablets Carton.jpg (10 mg Prasugrel Tablets Carton)
Prasugrel 10 mg film-coated tablets label showing a 30-count package (3 blister packs of 10 tablets each). The label includes the product name, dosage form, strength, quantity, and NDC 60687-883-21. It mentions the need to dispense a medication guide, storage conditions, usual dosage instructions, and distribution by American Health Packaging, Columbus, Ohio. The label also features a barcode and QR code for medication guide and prescribing information.*
FDA Label Image

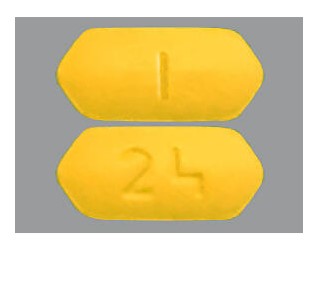
Ahp88321

Ahp88321
Prasugrel 10 mg film-coated tablet in yellow, oblong shape. One side is imprinted with a single vertical line, and the other side shows the imprint '24'.*
FDA Label Image

Figure 1: Non-cabg-related Timi Major Or Minor Bleeding Events. (Prasugrel Fig1)

Figure 1: Non-cabg-related Timi Major Or Minor Bleeding Events. (Prasugrel Fig1)
A line graph comparing the percentage of non-CABG-related TIMI major or minor bleeding events over 450 days from randomization in patients taking Prasugrel versus Clopidogrel. The graph includes a smaller inset chart showing a detailed view of the first 7 days. The number of patients at risk at various time points is noted below the x-axis for both drugs.*
FDA Label Image

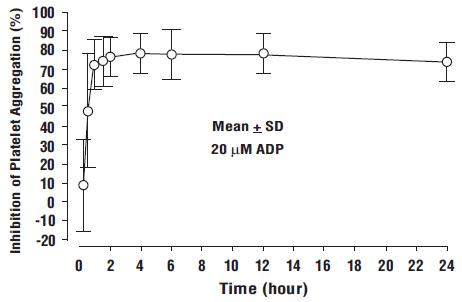
Figure 2: Inhibition (mean±sd) Of 20 μm Adp-induced Platelet Aggregation (ipa) Measured By Light Transmission Aggregometry After Prasugrel 60 mg. (Prasugrel Fig2)

Figure 2: Inhibition (mean±sd) Of 20 μm Adp-induced Platelet Aggregation (ipa) Measured By Light Transmission Aggregometry After Prasugrel 60 mg. (Prasugrel Fig2)
A line graph showing the inhibition of platelet aggregation (%) over time (hours) with mean ± SD values after treatment with 20 µM ADP. The graph plots inhibition from 0 to 24 hours, indicating a rapid rise in inhibition within the first few hours followed by a plateau.*
FDA Label Image

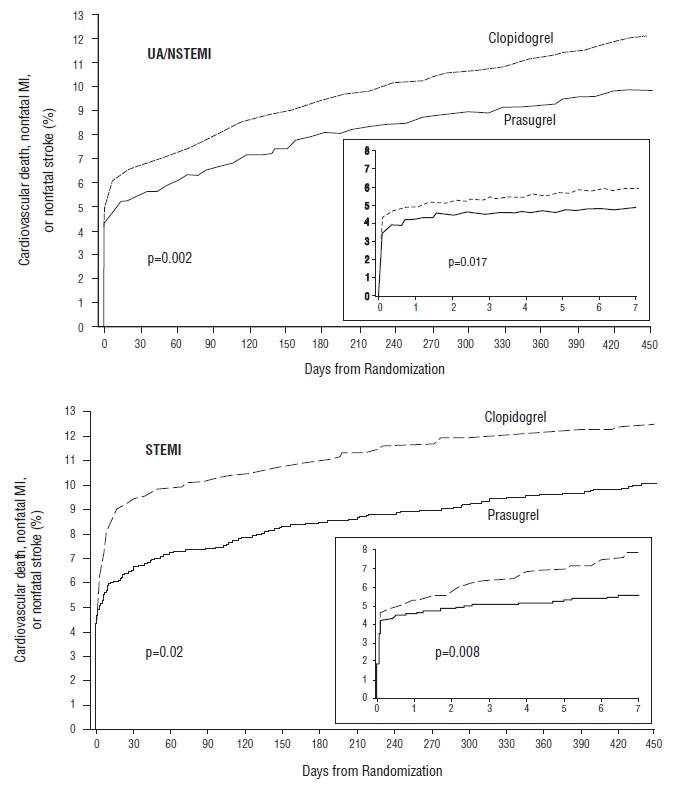
Figure 3: Time To First Event Of Cv Death, Mi, Or Stroke (triton-timi 38). (Prasugrel Fig3)

Figure 3: Time To First Event Of Cv Death, Mi, Or Stroke (triton-timi 38). (Prasugrel Fig3)
Two line graphs comparing cardiovascular event rates (cardiovascular death, nonfatal MI, nonfatal stroke) over time (days from randomization) between Prasugrel and Clopidogrel in UA/NSTEMI and STEMI patients. Each graph shows higher event percentages for Clopidogrel than Prasugrel, with inset zoomed views of early days and p-values indicating statistical analysis.*
FDA Label Image

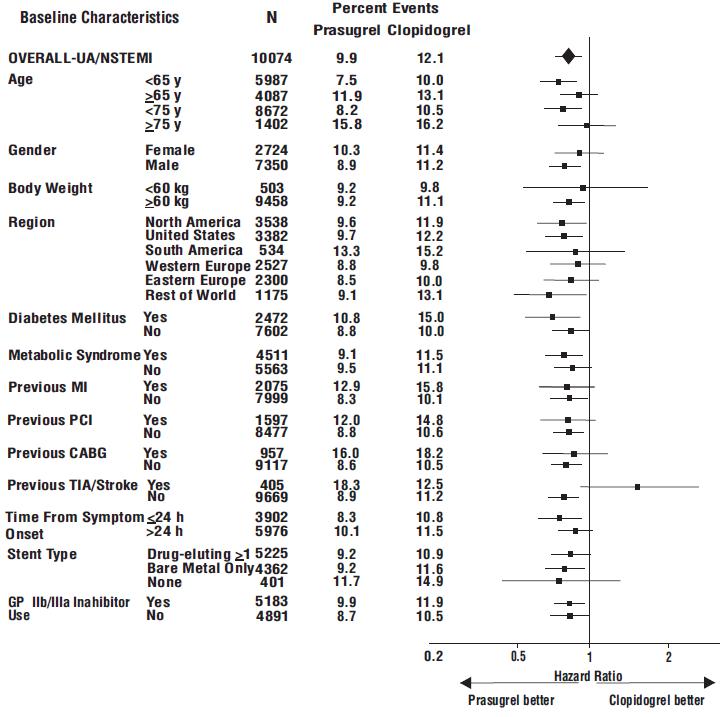
Figure 4: Subgroup Analyses For Time To First Event Of Cv Death, Mi, Or Stroke (hr And 95% Ci; Triton-timi 38) – Ua/nstemi Patients. (Prasugrel Fig4)

Figure 4: Subgroup Analyses For Time To First Event Of Cv Death, Mi, Or Stroke (hr And 95% Ci; Triton-timi 38) – Ua/nstemi Patients. (Prasugrel Fig4)
A hazard ratio forest plot comparing percent events of Prasugrel versus Clopidogrel across various baseline characteristics including age, gender, body weight, geographic region, diabetes status, metabolic syndrome, previous myocardial infarction, PCI, CABG, TIA/stroke, time from symptom onset, stent type, and GP IIb/IIIa inhibitor use. The plot visually presents subgroups with hazard ratios indicating relative effectiveness between Prasugrel and Clopidogrel.*
FDA Label Image

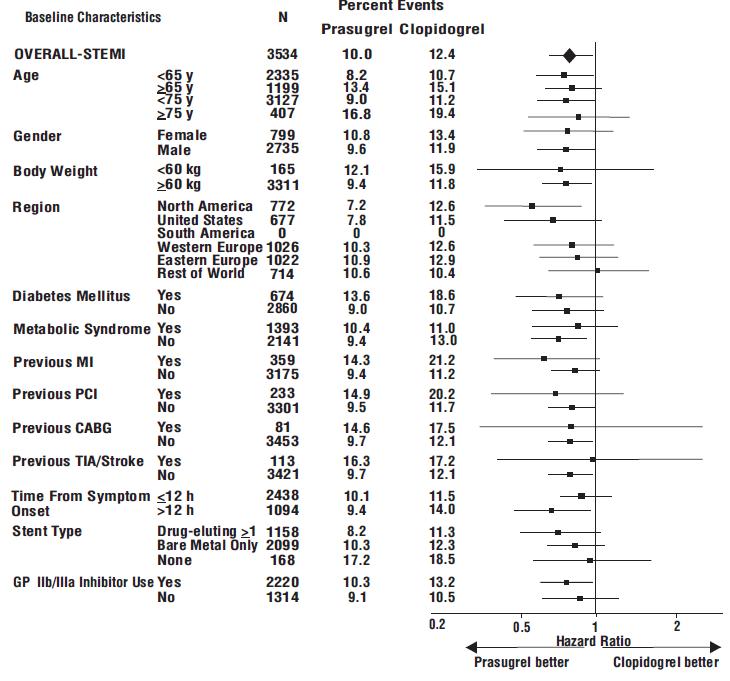
Figure5 (Prasugrel Fig5)

Figure5 (Prasugrel Fig5)
A hazard ratio forest plot comparing percent events between Prasugrel and Clopidogrel across multiple baseline characteristics including age, gender, body weight, geographic region, diabetes status, metabolic syndrome, prior medical history, symptom onset time, stent type, and GP IIb/IIIa inhibitor use. The x-axis reflects hazard ratios with an indication of treatment benefit for each drug.*
FDA Label Image

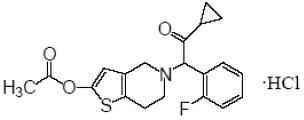
Chemical Structure (Prasugrel Str)

Chemical Structure (Prasugrel Str)
Chemical structure of prasugrel hydrochloride depicted as a molecular diagram showing its key functional groups, including a fluorophenyl, cyclopropyl carbonyl, thienopyridine ring, and acetate ester.*

* About these descriptions: Image descriptions on this page are generated by automated AI analysis of the product label images from the manufacturer's FDA label submission (SPL). They are provided for reference only and may contain errors or omissions. Always rely on the printed label itself and the official FDA labeling, and consult a pharmacist or healthcare professional with any questions about this product.