Risedronate Sodium Tablet, Film Coated
Product Images NDC 60723-041

View Photos of Packaging, Regulatory Labels, and Product Appearance

Product Visual Gallery

This gallery contains 9 technical images submitted to the FDA as part of the official labeling for Risedronate Sodium (NDC 60723-041). Unlike standard consumer photos, these assets often include clinical data figures, molecular chemical structures, and official manufacturer packaging layouts.

As provided by Hangzhou Minsheng Binjiang Pharmaceutical Co., Ltd, these visuals offer a comprehensive scientific overview of the product's physical and chemical identity, aiding pharmacists and researchers in product verification and study.

FDA Label Image

Image Description (Carton 12 Ct)

Image Description (Carton 12 Ct)
Risedronate Sodium Tablets, USP 35 mg film-coated tablets package label. The label indicates a once-a-week dosage with a 12-week supply, containing 4 blister cards each with 3 tablets. Labeler is Hangzhou Minsheng Binjiang Pharmaceutical Co., Ltd. Instructions for use include taking the tablet whole first thing in the morning with water and avoiding lying down or eating for 30 minutes after. The label includes an NDC 60723-041-12 and storage instructions.*
FDA Label Image

Image Description (Carton 4 Ct)

Image Description (Carton 4 Ct)
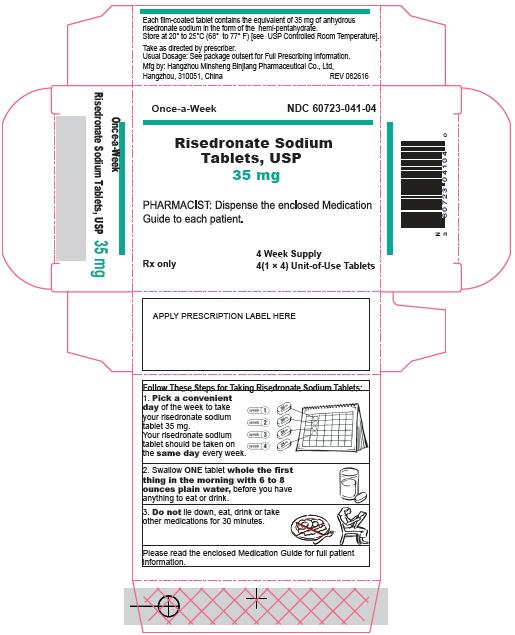
Packaging label for Risedronate Sodium Tablets USP 35 mg, film-coated oral tablets by Hangzhou Minsheng Binjiang Pharmaceutical Co., Ltd. The label states a four-week supply with 4 unit-of-use tablets, once-a-week dosing, and includes instructions for patient use. The label also features storage instructions, barcode, and directions to dispense the enclosed medication guide.*
FDA Label Image

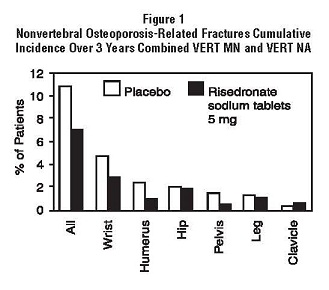
Image Description (Figure 1)

Image Description (Figure 1)
Bar chart titled 'Nonvertebral Osteoporosis-Related Fractures Cumulative Incidence Over 3 Years Combined VERT MN and VERT NA' comparing percentage of patients with fractures at different sites, including All, Wrist, Humerus, Hip, Pelvis, Leg, and Clavicle. Data for placebo and risedronate sodium tablets 5 mg are shown, with placebo generally showing higher fracture incidence percentages than risedronate sodium.*
FDA Label Image

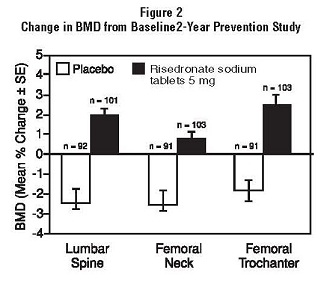
Image Description (Figure 2)

Image Description (Figure 2)
A bar chart titled 'Figure 2 Change in BMD from Baseline 2-Year Prevention Study' shows mean percent change in Bone Mineral Density (BMD) with standard error for three bone sites: Lumbar Spine, Femoral Neck, and Femoral Trochanter. It compares placebo and Risedronate Sodium 5 mg tablets groups, with the Risedronate group showing positive BMD changes while placebo shows negative or no changes.*
FDA Label Image

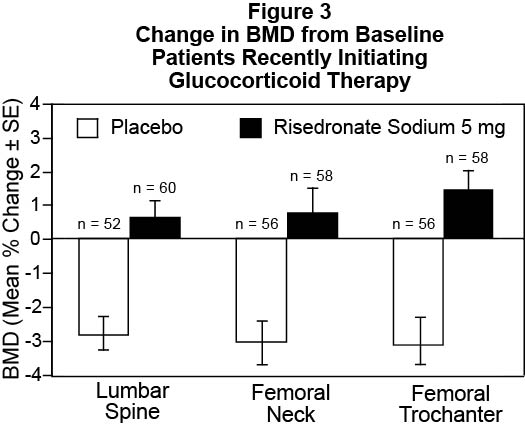
Image Description (Figure 3)

Image Description (Figure 3)
A bar chart titled 'Change in BMD from Baseline Patients Recently Initiating Glucocorticoid Therapy' comparing mean percent change in bone mineral density (BMD) plus standard error (SE) at three sites: lumbar spine, femoral neck, and femoral trochanter. Data is shown for placebo and 5 mg Risedronate Sodium groups, with Risedronate Sodium consistently showing increased BMD compared to placebo.*
FDA Label Image

Image Description (Figure 4)

Image Description (Figure 4)
A bar chart showing the mean percentage change in bone mineral density (BMD) from baseline in patients on long-term glucocorticoid therapy. The chart compares BMD changes at the lumbar spine, femoral neck, and femoral trochanter for two groups: placebo and Risedronate Sodium 5 mg. Error bars represent the standard error, and sample sizes are indicated for each group and location.*
FDA Label Image

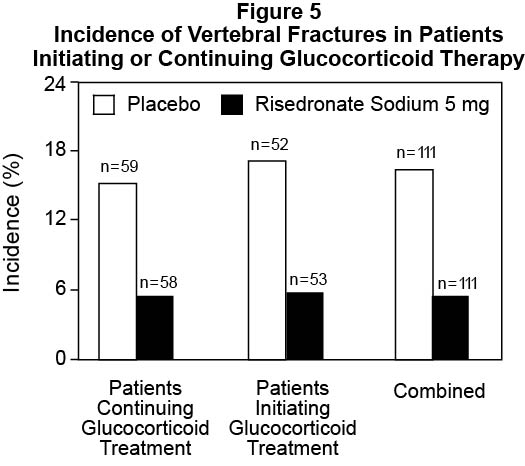
Image Description (Figure 5)

Image Description (Figure 5)
A bar chart showing the incidence percentage of vertebral fractures in patients either continuing or initiating glucocorticoid therapy, comparing placebo to Risedronate Sodium 5 mg. The incidence is lower in patients treated with Risedronate Sodium across all categories including patients continuing glucocorticoid treatment, patients initiating glucocorticoid treatment, and combined groups.*
FDA Label Image

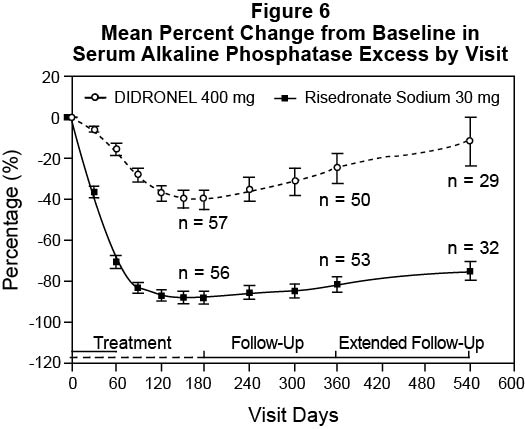
Image Description (Figure 6)

Image Description (Figure 6)
A line chart titled 'Mean Percent Change from Baseline in Serum Alkaline Phosphatase Excess by Visit' comparing DIDRONEL 400 mg and Risedronate Sodium 30 mg over visit days ranging from 0 to 540. The y-axis shows percentage change from 0% to -120%. Data points for both treatments show decreasing enzyme levels, with Risedronate Sodium showing greater reduction sustained over time. Sample sizes (n) are indicated at various time points.*
FDA Label Image

Image Description (Risedronate Sodium)

Image Description (Risedronate Sodium)
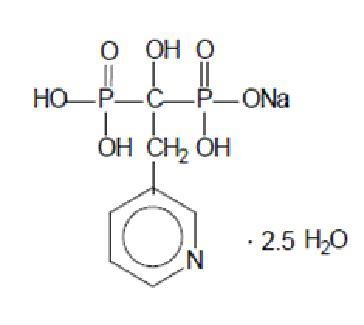
Chemical structure of Risedronate Sodium dihydrate showing its molecular components including the phosphonate groups and pyridine ring, along with associated water of hydration (2.5 molecules of H2O).*

* About these descriptions: Image descriptions on this page are generated by automated AI analysis of the product label images from the manufacturer's FDA label submission (SPL). They are provided for reference only and may contain errors or omissions. Always rely on the printed label itself and the official FDA labeling, and consult a pharmacist or healthcare professional with any questions about this product.