Tamsulosin Hydrochloride
Product Images NDC 60723-056

7 FDA label images from Hangzhou Minsheng Binjiang Pharmaceutical Co., Ltd. · Packaging, Regulatory Labels, and Product Appearance

Product Visual Gallery

This gallery contains 7 technical images submitted to the FDA as part of the official labeling for Tamsulosin Hydrochloride (NDC 60723-056). Unlike standard consumer photos, these assets often include clinical data figures, molecular chemical structures, and official manufacturer packaging layouts.

As provided by Hangzhou Minsheng Binjiang Pharmaceutical Co., Ltd., these visuals offer a comprehensive scientific overview of the product's physical and chemical identity, aiding pharmacists and researchers in product verification and study.

FDA Label Image

Figure-1 (Figure 1)

Figure-1 (Figure 1)
A line graph comparing plasma concentration (ng/mL) over time (hours) in fasted versus fed states. Time is on the x-axis spanning 0 to 36 hours, and plasma concentration on the y-axis from 0 to 25 ng/mL. The graph features two lines: a dashed line representing the fasted state and a solid line for the fed state, illustrating differences in plasma concentration profiles over time.*
FDA Label Image

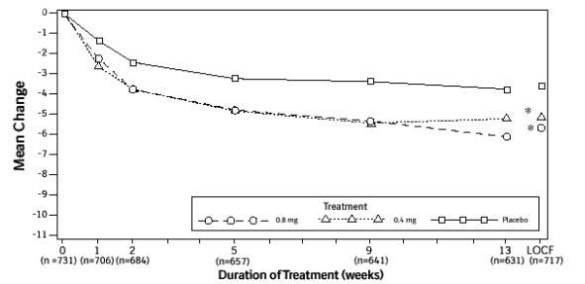
Figure-2-a (Figure 2 A)

Figure-2-a (Figure 2 A)
A line graph showing mean change over time across different treatments over a 13-week duration. The x-axis represents duration of treatment in weeks, and the y-axis shows mean change. Three treatment groups are compared: 0.8 mg dose, 0.4 mg dose, and placebo, indicated by circles, triangles, and squares respectively. The graph includes sample sizes at each time point.*
FDA Label Image

Figure-2-b (Figure 2 B)

Figure-2-b (Figure 2 B)
A line chart showing the mean change over the duration of treatment (weeks) for Tamsulosin Hydrochloride at 0.8 mg and 0.4 mg doses compared to placebo. The y-axis represents mean change, and the x-axis shows treatment duration up to 13 weeks with last observation carried forward (LOCF). Three lines represent the two dosage levels and placebo, indicating changes over time.*
FDA Label Image

Figure-3-a (Figure 3 A)

Figure-3-a (Figure 3 A)
A line graph showing mean change over time in mL/sec during a 13-week treatment period. It compares effects of two Tamsulosin Hydrochloride dosages, 0.8 mg and 0.4 mg, versus placebo. The x-axis represents treatment duration in weeks, and the y-axis represents mean change in mL/sec. Different markers distinguish each treatment group.*
FDA Label Image

Figure-3-b (Figure 3 B)

Figure-3-b (Figure 3 B)
A line graph showing the mean change in a measured variable (mL/sec) over the duration of treatment in weeks. The graph compares three groups: 0.8 mg, 0.4 mg, and placebo, each indicated with distinct markers (circle, triangle, square). The y-axis represents mean change values from 0 to 3, and the x-axis shows time points from baseline to 13 weeks, including a last observation carried forward (LOCF) point.*
FDA Label Image

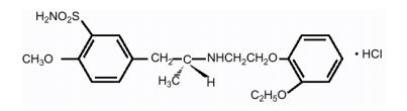
Structure (Structure)

Structure (Structure)
Chemical structure of Tamsulosin Hydrochloride illustrating its molecular connectivity, including aromatic rings, sulfonamide group, and hydrochloride component, as labeled in the product data.*
FDA Label Image

Tamsulosin-label (Tamsulosin Label)

Tamsulosin-label (Tamsulosin Label)
Label for Tamsulosin Hydrochloride 0.4 mg capsules by Hangzhou Minsheng Binjiang Pharmaceutical Co., Ltd. The label indicates 100 capsules, Rx only, with storage instructions and a barcode. It includes manufacturer information and notes to read prescribing information for dosage.*

* About these descriptions: Image descriptions on this page are generated by automated AI analysis of the product label images from the manufacturer's FDA label submission (SPL). They are provided for reference only and may contain errors or omissions. Always rely on the printed label itself and the official FDA labeling, and consult a pharmacist or healthcare professional with any questions about this product.