Pregabalin Capsule
Product Images NDC 60760-205

View Photos of Packaging, Regulatory Labels, and Product Appearance

Product Visual Gallery

This gallery contains 14 technical images submitted to the FDA as part of the official labeling for Pregabalin (NDC 60760-205). Unlike standard consumer photos, these assets often include clinical data figures, molecular chemical structures, and official manufacturer packaging layouts.

As provided by St. Mary's Medical Park Pharmacy, these visuals offer a comprehensive scientific overview of the product's physical and chemical identity, aiding pharmacists and researchers in product verification and study.

FDA Label Image

Pregaba (Pregabalin 60760 205 60)

Pregaba (Pregabalin 60760 205 60)
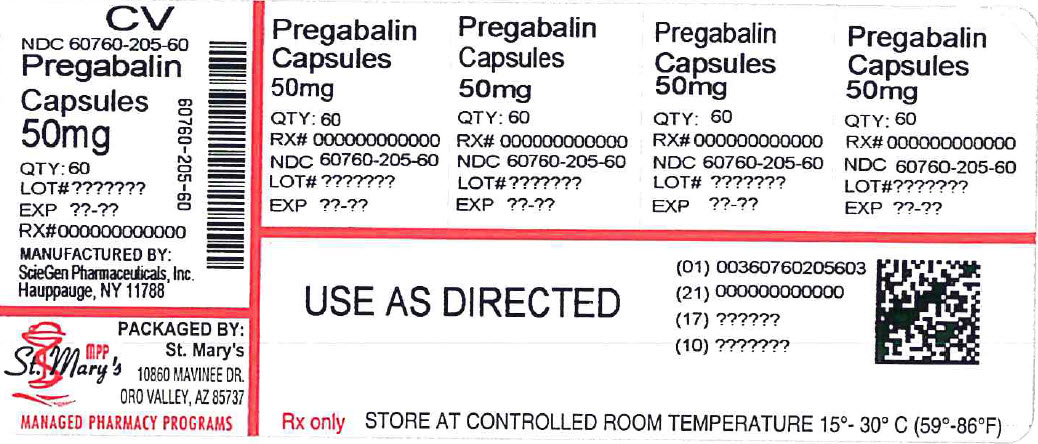
This is a description of a medication named Pregabalin distributed as capsules in bottles containing 60 capsules each. Four different bottle variants are listed that specify the dosage of the medicine as 50mg. A lot number, an expiry date, and a packaged-by are also mentioned. It is a prescription drug to be used as directed only. The pharmacy program is mentioned, as is the ideal storing temperature range.*
FDA Label Image

Figure 1 (Pregabalin Fig01)

FDA Label Image

Figure 2 (Pregabalin Fig02)

Figure 2 (Pregabalin Fig02)
The text provided is showing a table with headers "Percent of Patients Improved" and "Percent Improvement in Pain from Baseline". The data in the table are not very clear, but it seems to be related to the effectiveness of Pregabalin, a medication of 160 mg taken over three days, in reducing pain. However, due to some missing and unreadable characters, the information provided is not entirely available.*
FDA Label Image

Figure 3 (Pregabalin Fig03)

Figure 3 (Pregabalin Fig03)
This appears to be a chart or table displaying the percent of patients who experienced improvement in pain while taking different medications at various doses. The medications listed include "Pregatalin" and "Pregabain" at different doses, as well as "Pregabalin" at a specific dose. The chart also includes a measurement of percent improvement in pain from a baseline measurement. However, the formatting and errors make it difficult to accurately interpret the data.*
FDA Label Image

Figure 4 (Pregabalin Fig04)

FDA Label Image

Figure 5 (Pregabalin Fig05)

Figure 5 (Pregabalin Fig05)
This document appears to be a chart or table showing the dosage of two medications, Fregabalin and Pregataiin, as well as a placebo, administered three times daily. The chart also shows the percentage of patients who improved while taking each medication, as well as the percentage of improvement in pain from baseline. It is not clear what the context or purpose of the chart is.*
FDA Label Image

Figure 6 (Pregabalin Fig06)

FDA Label Image

Figure 7 (Pregabalin Fig07)

FDA Label Image

Figure 9 (Pregabalin Fig08)

FDA Label Image

Figure 10 (Pregabalin Fig09)

Figure 10 (Pregabalin Fig09)
This appears to be a table indicating estimated percentages of subjects without LTR (not sure what LTR stands for) in a study, with two groups labeled "Progabain" and "Placebo", and time points indicated in days. Not much context is given to further understand the significance of this data.*
FDA Label Image

Figure 11 (Pregabalin Fig10)

FDA Label Image

Figure 12 (Pregabalin Fig11)

Figure 12 (Pregabalin Fig11)
The text shows a chart indicating the percentage of subjects who have improved in a certain period of time, from baseline to week 16. There are two groups compared, one who has taken pregabalin and the other who has taken a placebo. The percentage of subjects improved ranges from 100% to 280%.*
FDA Label Image

Cockcroft And Gault Equation (Pregabalin Formula)

Cockcroft And Gault Equation (Pregabalin Formula)
This appears to be a formula for calculating creatinine clearance (CLCT), which is an important measure of kidney function. The calculation involves subtracting the patient's age from 140, then multiplying that number by their weight in kilograms. The result is then multiplied by 0.85 for female patients. The final step is to multiply the product by the patient's serum creatinine level in milligrams per deciliter (mg/dL) and divide by 72. CLCT is commonly used to evaluate the severity of kidney disease and to determine dosages of medications that are cleared by the kidneys.*
FDA Label Image

Chemical Structure (Pregabalin Str)

* These product label images have been analyzed using experimental machine learning. Please verify findings with the primary label text.