Tamsulosin Hydrochloride
Product Images NDC 60760-450

7 FDA label images from St. Mary's Medical Park Pharmacy · Packaging, Regulatory Labels, and Product Appearance

Product Visual Gallery

This gallery contains 7 technical images submitted to the FDA as part of the official labeling for Tamsulosin Hydrochloride (NDC 60760-450). Unlike standard consumer photos, these assets often include clinical data figures, molecular chemical structures, and official manufacturer packaging layouts.

As provided by St. Mary's Medical Park Pharmacy, these visuals offer a comprehensive scientific overview of the product's physical and chemical identity, aiding pharmacists and researchers in product verification and study.

FDA Label Image

Tams (Tamsulosin 60760 450 90)

Tams (Tamsulosin 60760 450 90)
Tamsulosin Hydrochloride 0.4 mg capsules, USP, with a quantity of 90 per package. The label includes the NDC 60760-450-90 and indicates it is manufactured by Macleods Pharmaceuticals Ltd., India, and packaged by St. Mary's Medical Park Pharmacy in Oro Valley, AZ. The label instructs use as directed and storage at controlled room temperature 15°-30°C (59°-86°F).*
FDA Label Image

Fig (Tamsulosin Fig 1)

Fig (Tamsulosin Fig 1)
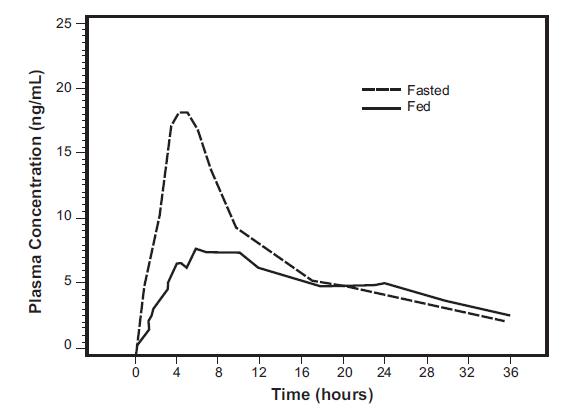
A line graph showing plasma concentration (ng/mL) of Tamsulosin Hydrochloride over time (hours) comparing fasted and fed states. The graph depicts how the drug concentration changes within 36 hours, with separate curves for fasted (dashed line) and fed (solid line) conditions.*
FDA Label Image

Fig (Tamsulosin Fig 2a)

Fig (Tamsulosin Fig 2a)
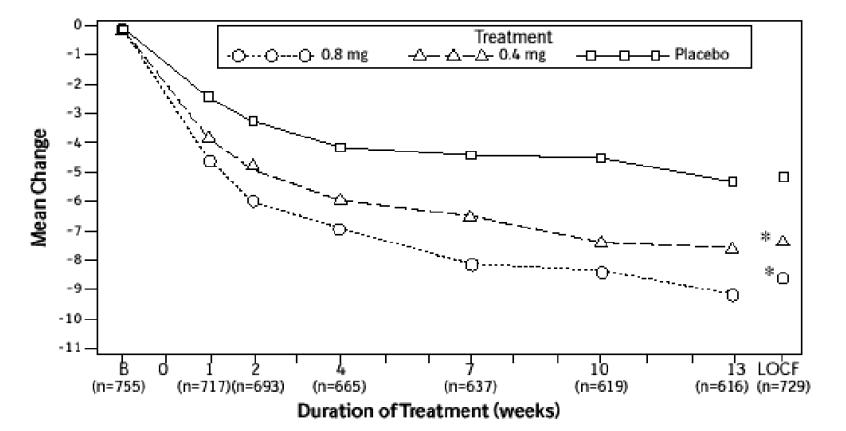
A line graph depicting the mean change over a duration of treatment in weeks, comparing three groups: Tamsulosin Hydrochloride 0.8 mg, 0.4 mg, and placebo. The y-axis shows mean change values from 0 to -11, and the x-axis covers treatment duration from baseline to 13 weeks plus LOCF (Last Observation Carried Forward). Data points illustrate a greater mean change with 0.8 mg and 0.4 mg doses compared to placebo.*
FDA Label Image

Fig (Tamsulosin Fig 2b)

Fig (Tamsulosin Fig 2b)
A line graph depicting the mean change in a measured variable over the duration of treatment in weeks, comparing three groups: Tamsulosin Hydrochloride 0.8 mg, 0.4 mg, and placebo. The x-axis shows treatment duration from 0 to 13 weeks, including LOCF (last observation carried forward), and the y-axis shows mean change values ranging from 0 to -11. Data points indicate a greater mean change in the 0.8 mg and 0.4 mg groups compared to placebo over time.*
FDA Label Image

Fig (Tamsulosin Fig 3a)

Fig (Tamsulosin Fig 3a)
A line graph showing mean change in a variable (mL/sec) over a 13-week treatment period for Tamsulosin Hydrochloride 0.4 mg and 0.8 mg doses compared to placebo. The x-axis represents the duration of treatment in weeks, and the y-axis represents the mean change. Data points include baseline and multiple weekly intervals.*
FDA Label Image

Fig (Tamsulosin Fig 3b)

Fig (Tamsulosin Fig 3b)
A line graph displaying mean change over treatment duration in weeks for Tamsulosin Hydrochloride doses of 0.4 mg and 0.8 mg, compared with placebo. The y-axis shows mean change in mL/sec, while the x-axis represents weeks of treatment, including a last observation carried forward (LOCF) marker. Lines with different symbols represent the three groups.*
FDA Label Image

Str (Tamsulosin Str)

Str (Tamsulosin Str)
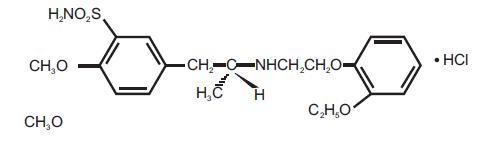
Chemical structure diagram of Tamsulosin Hydrochloride showing its molecular components, including aromatic rings, methoxy groups, and hydrochloride.*

* About these descriptions: Image descriptions on this page are generated by automated AI analysis of the product label images from the manufacturer's FDA label submission (SPL). They are provided for reference only and may contain errors or omissions. Always rely on the printed label itself and the official FDA labeling, and consult a pharmacist or healthcare professional with any questions about this product.