Product Images Pregabalin
View Photos of Packaging, Labels & Appearance
Product Label Images
The following 14 images provide visual information about the product associated with Pregabalin NDC 60760-485 by St. Mary's Medical Park Pharmacy, such as packaging, labeling, and the appearance of the drug itself. This resource could be helpful for medical professionals, pharmacists, and patients seeking to verify medication information and ensure they have the correct product.
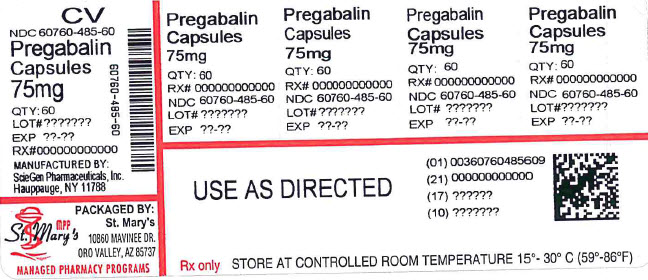
This is a description of Pregabalin capsules manufactured by ScoGen Pharmaceuticals in Hauppauge, NY. Each capsule contains either 75mg or 225mg of Pregabalin. The capsules are packaged in bottles containing 60 or 50 capsules. The lot number of each bottle is provided. This product should be stored at room temperature. The document also includes a reference to a "managed pharmacy program."*
The text provides a table or chart listing percentage improvement in pain from the baseline of patients taking Pregabalin 160 mg for 3 days. The table has a range of numbers from 2 to 100. There are also some numerical values of 220, 23, 20, and 280 with no clear indication of what they represent. The text also mentions the word "Facebo" which could be a misspelling of the social media platform "Facebook", but it is unclear how it relates to the rest of the information. Overall, this text provides limited and unclear information, making it not very useful.*
This document appears to be a chart showing different medications and dosages, along with a percentage of patients who experienced improvement in pain. The medications listed include Pregatalin and Pregabalin, administered in varying dosages, as well as Flaosbo (which may be a misspelling or error). The chart contains some numerical values and dates but without proper context, it is not clear what these values represent.*
This is a study report that compares the effectiveness of Fregabalin, Pregataiin and placebo in reducing pain. The doses administered were Fregabalin 100 mg thrice daily, Pregataiin 80 mg thrice daily, and placebo respectively. The chart shows that 83.8% of patients improved when treated with Fregabalin, whereas the percentage of improvement was not available for Pregataiin and placebo. Additionally, the table displays the percentage of pain improvement from baseline, where the highest percentage of improvement was achieved with Fregabalin.*
The text represents a table with headers "L Study", "E1 Study", "E3 Study", and "S5". The rest of the table contains dosage information for Placebo, SOmg/day, 150mg/day, 300mg/day, and 600mg/day. The text also mentions that the results were statistically significant compared to the placebo.*
The text shows a graph comparing the percentage of patients who improved their pain levels from a baseline using Pregabalin at a daily dose of 300mg or 450mg, as well as a placebo. There is an axis indicating the percent improvement in pain from a baseline, ranging from 20 to 80 percent. No further information is available from the text.*
This is a chart that displays the estimated percentage of subjects without LTR over a period of 120 days. Two treatments are being compared: "Progabain" and "Placebo". The x-axis shows the days of the study, while the y-axis shows the percentage of subjects without LTR.*
The text represents a chart or a graph showing the percent of subjects improved from baseline to week 16 BOCF for Pregabalin and Placebo. The values range from 100% to 280%.*
This text appears to be part of a medical calculation for estimating a patient's creatinine clearance (CLCT), which is a measure of kidney function. The formula involves subtracting the patient's age in years from 140, then multiplying that result by the patient's weight in kilograms. For female patients, the result is then multiplied by 0.85. The next step is to multiply the result by the serum creatinine level (in milligrams per deciliter) and finally by 72. This calculation is often used to determine appropriate drug dosages for patients with impaired renal function.*
* The product label images have been analyzed using a combination of traditional computing and machine learning techniques. It should be noted that the descriptions provided may not be entirely accurate as they are experimental in nature. Use the information in this page at your own discretion and risk.