Pregabalin
Product Images NDC 60760-486

View Photos of Packaging, Regulatory Labels, and Product Appearance

Product Visual Gallery

This gallery contains 14 technical images submitted to the FDA as part of the official labeling for Pregabalin (NDC 60760-486). Unlike standard consumer photos, these assets often include clinical data figures, molecular chemical structures, and official manufacturer packaging layouts.

As provided by St. Mary's Medical Park Pharmacy, these visuals offer a comprehensive scientific overview of the product's physical and chemical identity, aiding pharmacists and researchers in product verification and study.

FDA Label Image

Prega (Pregabalin 60760 486 90)

Prega (Pregabalin 60760 486 90)
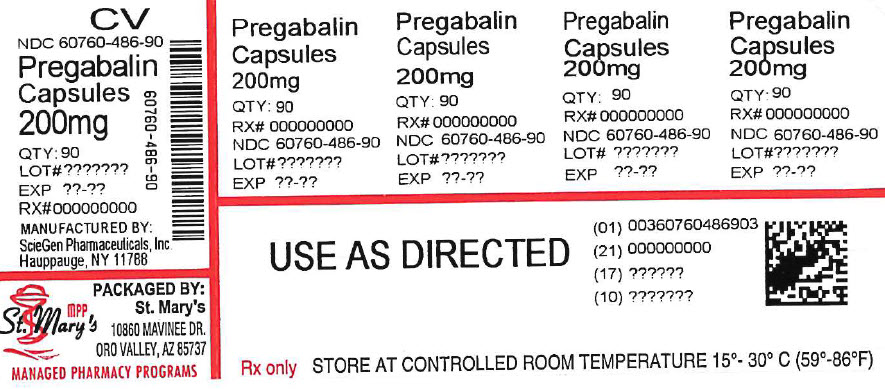
This is a description of a medication named Pregabalin in capsule form with a strength of 200mg. It shows the different quantities that the medication can be bought in and the RX numbers of the capsules. It also displays the manufacturing information and the contact for the company that manages pharmacy programs. The medication should be stored at room temperature, and the instructions state to use as directed.*
FDA Label Image

Figure 1 (Pregabalin Fig01)

FDA Label Image

Figure 2 (Pregabalin Fig02)

Figure 2 (Pregabalin Fig02)
The text shows a table indicating the percentage of patients improved based on the dosage of Pregabalin (160 mg) given over a period of 3 days. There is also a mention of improvement in pain from the baseline. However, the table appears incomplete with random numbers and characters that are not clear, making it difficult to draw a meaningful conclusion.*
FDA Label Image

Figure 3 (Pregabalin Fig03)

Figure 3 (Pregabalin Fig03)
This is a chart displaying the percent of improvement in pain for patients taking different medications, including Pregatalin and Pregabain, with varying dosages and frequency. There is also a graph showing the percentage of improvement over time.*
FDA Label Image

Figure 4 (Pregabalin Fig04)

FDA Label Image

Figure 5 (Pregabalin Fig05)

Figure 5 (Pregabalin Fig05)
This appears to be a table depicting the results of a study evaluating the effectiveness of three different interventions (Fregabalin 100 mg three times a day, Pregataiin 80 mg three times a day, and Placebo) in reducing pain for patients. The table shows the percentage of patients who improved after the interventions, as well as the percent improvement in pain from baseline for each intervention.*
FDA Label Image

Figure 6 (Pregabalin Fig06)

Figure 6 (Pregabalin Fig06)
The provided text contains a table with information related to the dosages and efficacy of a product under study. Dosages from 50mg/day to 600mg/day were used, and the efficacy of the product was statistically significant compared to the placebo. No further information is available.*
FDA Label Image

Figure 7 (Pregabalin Fig07)

FDA Label Image

Figure 9 (Pregabalin Fig08)

FDA Label Image

Figure 10 (Pregabalin Fig09)

Figure 10 (Pregabalin Fig09)
This appears to be a chart with estimated percentages of subjects without LTR (long-term response) for two different treatments, Progabain and Placebo, over a period of 120 days. The percentage values range from 0% to 100% with 10 day intervals.*
FDA Label Image

Figure 11 (Pregabalin Fig10)

FDA Label Image

Figure 12 (Pregabalin Fig11)

Figure 12 (Pregabalin Fig11)
This table shows the percent of subjects who improved from baseline to Week 16 for a study on Pregabalin compared to a placebo. The percent of subjects improved is listed on the left-hand side, and the measurements for improvement are listed on the bottom row. The measurements are in the range of 210 to 280.*
FDA Label Image

Cockcroft And Gault Equation (Pregabalin Formula)

Cockcroft And Gault Equation (Pregabalin Formula)
This text appears to be describing a formula for calculating creatinine clearance, a measure of how well a person's kidneys are filtering blood. The formula involves subtracting the patient's age (in years) from 140, then multiplying that result by their weight in kilograms. For female patients, this result is then multiplied by 0.85. Finally, the formula involves multiplying the result of these calculations by the patient's serum creatinine level (in milligrams per deciliter).*
FDA Label Image

Chemical Structure (Pregabalin Str)

* These product label images have been analyzed using experimental machine learning. Please verify findings with the primary label text.