Pregabalin Capsule
Product Images NDC 60760-507

View Photos of Packaging, Regulatory Labels, and Product Appearance

Product Visual Gallery

This gallery contains 14 technical images submitted to the FDA as part of the official labeling for Pregabalin (NDC 60760-507). Unlike standard consumer photos, these assets often include clinical data figures, molecular chemical structures, and official manufacturer packaging layouts.

As provided by St. Mary's Medical Park Pharmacy, these visuals offer a comprehensive scientific overview of the product's physical and chemical identity, aiding pharmacists and researchers in product verification and study.

FDA Label Image

Pregab (Pregabalin 60760 507 60)

Pregab (Pregabalin 60760 507 60)
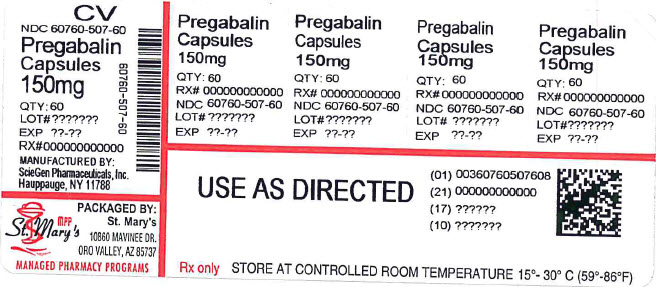
This is a pharmaceutical label for a drug called Pregabalin. The drug comes in capsule form with a dosage of 150mg. The label contains storage instructions to store the drug at a temperature between 15°- 30° C. The label has a lot number, expiration date and manufacturer details.*
FDA Label Image

Figure 1 (Pregabalin Fig01)

FDA Label Image

Figure 2 (Pregabalin Fig02)

Figure 2 (Pregabalin Fig02)
This appears to be a table showing the percent improvement in pain for patients taking Pregabalin 160mg over a period of 3 days. The table also includes some numerical values, but it is unclear what they represent. The text from the table is also missing some characters, making it difficult to interpret.*
FDA Label Image

Figure 3 (Pregabalin Fig03)

Figure 3 (Pregabalin Fig03)
This appears to be a table or chart showing the percentage improvement in pain for patients using different medications (Pregatalin, Pregabain, and Pregabalin) at different dosages and frequencies. The numbers 8, 88, and 83888 may correspond to different levels of improvement. The last line seems to show the time frame of the study, including a year and a week. Without more context or information, it is difficult to provide a more detailed description.*
FDA Label Image

Figure 4 (Pregabalin Fig04)

FDA Label Image

Figure 5 (Pregabalin Fig05)

Figure 5 (Pregabalin Fig05)
This appears to be a table showing the results of a study on pain relief medication. The table lists three different medications (Fregabalin, Pregataiin, and Placebo) and the number of times they were taken each day. The table also shows the percentage of patients who showed improvement in their pain, as well as the percentage improvement in pain compared to the baseline. However, the text is not completely accurate and contains errors, making interpretation difficult.*
FDA Label Image

Figure 6 (Pregabalin Fig06)

FDA Label Image

Figure 7 (Pregabalin Fig07)

FDA Label Image

Figure 9 (Pregabalin Fig08)

Figure 9 (Pregabalin Fig08)
The text shows a graph displaying the percent of patients improved for Pregabalin at two different daily doses and Placebo. The X-axis displays the percent improvement in pain from baseline while the Y-axis displays the percentage of patients improved. The text does not provide any further information or context.*
FDA Label Image

Figure 10 (Pregabalin Fig09)

Figure 10 (Pregabalin Fig09)
This table shows estimated percentages of subjects without LTR (likely to refer to "low-threshold readiness") for different time intervals in days, ranging from 0 to 180. The data is related to Progabain and Placebo interventions, but there is not enough context to understand the nature of the interventions or LTR.*
FDA Label Image

Figure 11 (Pregabalin Fig10)

FDA Label Image

Figure 12 (Pregabalin Fig11)

Figure 12 (Pregabalin Fig11)
The text provides a chart showing the improvement of subjects in percentage from baseline to week 16 under the medication of Pregabalin and Placebo. The chart shows values ranging from 100 to 280, with the x-axis ranging from 210 to 270.*
FDA Label Image

Cockcroft And Gault Equation (Pregabalin Formula)

Cockcroft And Gault Equation (Pregabalin Formula)
This appears to be a formula for calculating creatinine clearance (CLCT) using the patient's age, weight and serum creatinine level. However, some of the characters in the formula are not readable due to the "mmmmm" and "e e" present. It is not possible to provide an accurate description with incomplete information.*
FDA Label Image

Chemical Structure (Pregabalin Str)

* These product label images have been analyzed using experimental machine learning. Please verify findings with the primary label text.