Product Images Tamsulosin Hydrochloride
View Photos of Packaging, Labels & Appearance
- Tamsulosin 60760 598 90
- Figure 1 Mean Plasma Tamsulosin Hydrochloride Concentrations Following Single-Dose Administration of Tamsulosin Hydrochloride Capsules 0.4 mg Under Fasted and Fed Conditions (n=8) - tamsulosin fig1
- Figure 2A Mean Change from Baseline in Total AUA Symptom Score (0 to 35) Study 1 - tamsulosin fig2
- Figure 2B Mean Change from Baseline in Total AUA Symptom Score (0 to 35) Study 2 - tamsulosin fig3
- Figure 3A Mean Increase in Peak Urine Flow Rate (mL/Sec) Study 1 - tamsulosin fig4
- Figure 3B Mean Increase in Peak Urine Flow Rate (mL/Sec) Study 2 - tamsulosin fig5
- Chemical Structure - tamsulosin str
Product Label Images
The following 7 images provide visual information about the product associated with Tamsulosin Hydrochloride NDC 60760-598 by St. Mary�s Medical Park Pharmacy, such as packaging, labeling, and the appearance of the drug itself. This resource could be helpful for medical professionals, pharmacists, and patients seeking to verify medication information and ensure they have the correct product.
Tamsulosin 60760 598 90

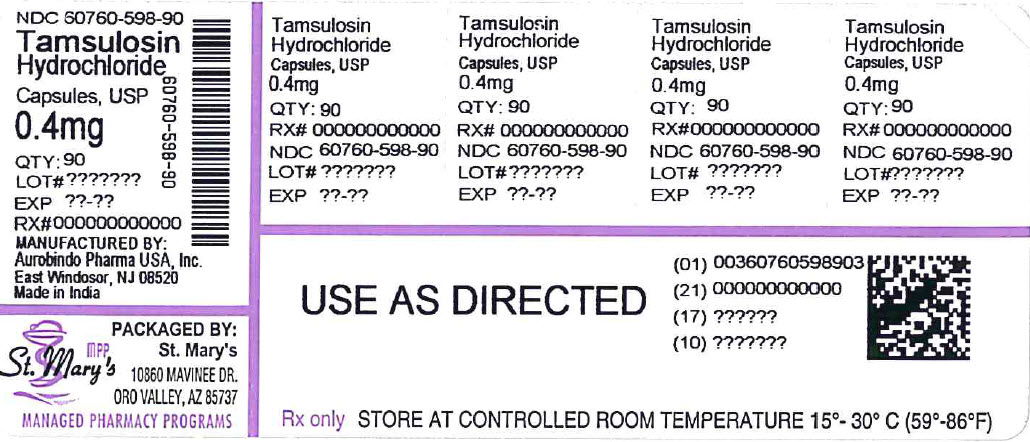
This is a description of Tamsulosin Hydrochloride Capsules, USP 0.4mg. The bottle contains 90 capsules with the NDC code 60760-598-90, Lot number 222277?, and expiration date 72-77. The medication is manufactured by Aurobindo Pharma USA, located at East Windosor in NJ, made in India. The label also provides directions for use and storage temperature recommendations.*
Figure 1 Mean Plasma Tamsulosin Hydrochloride Concentrations Following Single-Dose Administration of Tamsulosin Hydrochloride Capsules 0.4 mg Under Fasted and Fed Conditions (n=8) - tamsulosin fig1

This appears to be a figure with two graphs showing the mean plasma concentrations of tamsulosin hydrochloride capsules 0.4 mg under fasted and fed conditions. The x-axis shows time in hours, while the y-axis shows the concentration of the drug.*
Figure 2A Mean Change from Baseline in Total AUA Symptom Score (0 to 35) Study 1 - tamsulosin fig2

This appears to be a figure (Figure 2A) displaying the mean change from baseline in Total AUA Symptom Score (measured on a scale of 0 to 35) in Study 1. The figure compares the results of the treatment (0.08mg) to a placebo over a duration of 13 weeks using LOCF analysis. The number of participants (n) in each group is provided. No further information is available from the given text.*
Figure 3A Mean Increase in Peak Urine Flow Rate (mL/Sec) Study 1 - tamsulosin fig4

The figure 3A shows the mean increase in peak urine flow rate in L/sec for study 1. The treatment groups include 0.08mg, 0.4mg, and Placebo. The mean change in mL/sec is shown over the duration of treatment in weeks. There were different sample sizes for each group ranging from 621 to 755.*
Figure 3B Mean Increase in Peak Urine Flow Rate (mL/Sec) Study 2 - tamsulosin fig5

This text appears to be a figure caption or title related to a study investigating the mean increase in peak urine flow rate. The figure shows the results of Study 2 and displays the change in flow rate (measured in mL/Sec) over the course of 20 weeks of treatment. There are also some unreadable characters present.*
* The product label images have been analyzed using a combination of traditional computing and machine learning techniques. It should be noted that the descriptions provided may not be entirely accurate as they are experimental in nature. Use the information in this page at your own discretion and risk.