Pregabalin Capsule
Product Images NDC 60760-681

View Photos of Packaging, Regulatory Labels, and Product Appearance

Product Visual Gallery

This gallery contains 15 technical images submitted to the FDA as part of the official labeling for Pregabalin (NDC 60760-681). Unlike standard consumer photos, these assets often include clinical data figures, molecular chemical structures, and official manufacturer packaging layouts.

As provided by St. Mary's Medical Park Pharmacy, these visuals offer a comprehensive scientific overview of the product's physical and chemical identity, aiding pharmacists and researchers in product verification and study.

FDA Label Image

681-30 (Pregabalin 60760 681 30)

681-30 (Pregabalin 60760 681 30)
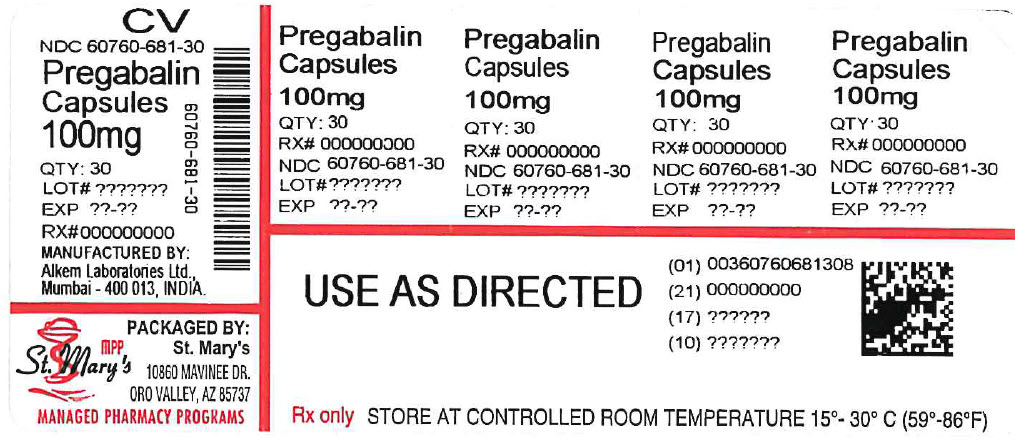
This text appears to be a label for Pregabalin capsules, each containing 100mg of the active ingredient. The label includes details like NDC, lot numbers, expiration dates, and usage instructions to be followed. The product is packaged in a controlled room temperature environment. The manufacturing information indicates a location in Mumbai, India.*
FDA Label Image

Pregabalin-equation (Pregabalin Equation)

Pregabalin-equation (Pregabalin Equation)
This is not available as the text is a mathematical formula and not a meaningful description.*
FDA Label Image

Pregabalin-fig-a (Pregabalin Fig A)

Pregabalin-fig-a (Pregabalin Fig A)
This text provides information on Responder Rate (%) with different dosage levels. It includes percentages such as 201%, placebo, and dosages like 2.5 and 10 mg/kg/day.*
FDA Label Image

Pregabalin-figure-6 (Pregabalin Figure 6)

Pregabalin-figure-6 (Pregabalin Figure 6)
This text likely contains data from different studies comparing the effects of different dosages of a medication on a particular outcome, likely with a placebo group for comparison. The data shows percentages and statistical significance of the different dosages compared to the placebo group.*
FDA Label Image

Pregabalin-figure-7 (Pregabalin Figure 7)

FDA Label Image

Study Dpn 1 (Pregabalin Image 1)

FDA Label Image

Study Sci 1 (Pregabalin Image 10)

FDA Label Image

Pain Intensity-study Sci 2 (Pregabalin Image 11)

FDA Label Image

Study Dpn 2 (Pregabalin Image 2)

FDA Label Image

Study Phn 1 (Pregabalin Image 3)

FDA Label Image

Study Phn 2 (Pregabalin Image 4)

Study Phn 2 (Pregabalin Image 4)
This text mentions the improvement in patients, with reference to the use of pregabalin at different dosages and placebo. It also indicates a percentage of improvement in pain from the baseline.*
FDA Label Image

Study Phn 3 (Pregabalin Image 5)

Study Phn 3 (Pregabalin Image 5)
This text provides information on the percentage of patients who improved with different treatments. It mentions Pregatalin taken multiple times a day and a placebo. The data seems to be related to the improvement in pain from a baseline.*
FDA Label Image

Fibromyalgia Study F1 (Pregabalin Image 8)

Fibromyalgia Study F1 (Pregabalin Image 8)
This text provides information on the percentage of patients improved with different doses of Pregabalin. It includes data for Pregabalin doses of 50mg, 450mg, and 300mg daily. Additionally, it presents the percentage of improvement in pain from baseline.*
FDA Label Image

Fibromyalgia Study F2 (Pregabalin Image 9)

FDA Label Image

Pregabalin Structure (Pregabalin Srtuc 1)

* These product label images have been analyzed using experimental machine learning. Please verify findings with the primary label text.