Product Images Pregabalin
View Photos of Packaging, Labels & Appearance
- 60760-729 - PREGABALIN 60760 729 60
- pregabalin-equation - pregabalin equation
- pregabalin-fig-a - pregabalin fig a
- pregabalin-Figure-6 - pregabalin figure 6
- pregabalin-Figure-7 - pregabalin figure 7
- Study DPN 1 - pregabalin image 1
- Study SCI 1 - pregabalin image 10
- Pain Intensity-study SCI 2 - pregabalin image 11
- Study DPN 2 - pregabalin image 2
- Study PHN 1 - pregabalin image 3
- Study PHN 2 - pregabalin image 4
- Study PHN 3 - pregabalin image 5
- Fibromyalgia Study F1 - pregabalin image 8
- Fibromyalgia Study F2 - pregabalin image 9
- Pregabalin structure - pregabalin srtuc 1
Product Label Images
The following 15 images provide visual information about the product associated with Pregabalin NDC 60760-729 by St. Mary's Medical Park Pharmacy, such as packaging, labeling, and the appearance of the drug itself. This resource could be helpful for medical professionals, pharmacists, and patients seeking to verify medication information and ensure they have the correct product.
60760-729 - PREGABALIN 60760 729 60

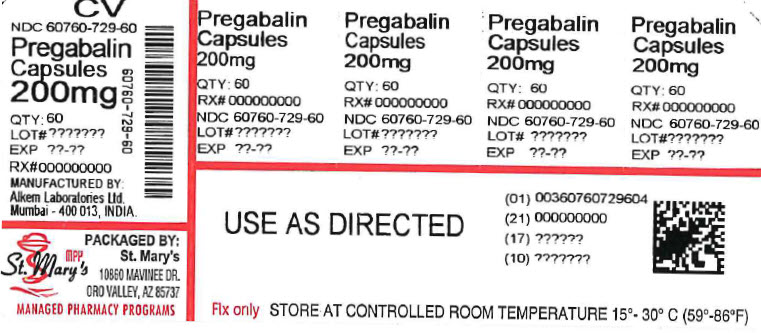
This text contains information about Pregabalin capsules with different strengths (100mg, 200mg), product details such as NDC code, lot number, expiration date, and manufacturer's address. It also includes directions for use, storage instructions, and mentions a pharmacy program. The product is recommended to be stored at controlled room temperature.*
pregabalin-fig-a - pregabalin fig a

This information appears to be related to a study or experiment involving a placebo and different dosages of a substance. The "Responder Rate (%)" is shown as 201%, with varying dosages listed for a placebo and another substance. The details seem to be incomplete and may require additional context for a clearer interpretation.*
pregabalin-Figure-6 - pregabalin figure 6

This text seems to refer to the results of studies comparing different dosages of a treatment with a placebo. The study includes various dosage levels ranging from 50 mg/day to 600 mg/day and reports percentage outcomes for specific parameters. The results from Study E1 and Study E3 indicate a statistically significant difference compared to the placebo group. The text suggests a comparison of effectiveness between these dosages and a placebo in the study.*
Study PHN 2 - pregabalin image 4

This description pertains to the improvement of patients through different medications such as Pregabalin in varying dosages, along with a placebo. The text includes metrics suggesting the percentage of improvement in pain from the baseline.*
Fibromyalgia Study F1 - pregabalin image 8

This text provides information on the percentage of patients who experienced improvement in pain with different doses of Pregabalin. The table shows the percentage of improvement in pain for various daily doses of Pregabalin, including 100mg, 450mg, and 300mg. Additionally, it indicates the percentage of patients improved from baseline pain levels. *
* The product label images have been analyzed using a combination of traditional computing and machine learning techniques. It should be noted that the descriptions provided may not be entirely accurate as they are experimental in nature. Use the information in this page at your own discretion and risk.