751-60 (Pregabalin 60760 751 60)
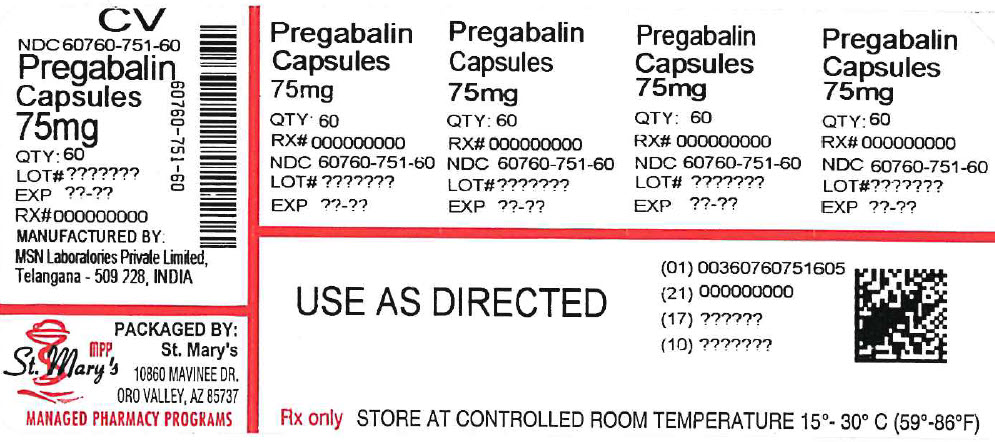
This text appears to be a label for Pregabalin capsules. The label includes information such as the quantity of capsules (60), dosage strength (75mg), manufacturer details, lot numbers, expiration dates, and storage instructions. Pregabalin is a medication used to treat nerve pain.*