Terazosin
Product Images NDC 60760-816

View Photos of Packaging, Regulatory Labels, and Product Appearance

Product Visual Gallery

This gallery contains 13 technical images submitted to the FDA as part of the official labeling for Terazosin (NDC 60760-816). Unlike standard consumer photos, these assets often include clinical data figures, molecular chemical structures, and official manufacturer packaging layouts.

As provided by St Mary's Medical Park Pharmacy, these visuals offer a comprehensive scientific overview of the product's physical and chemical identity, aiding pharmacists and researchers in product verification and study.

FDA Label Image

Image (98351704 9ff8 4c54 A2c2 E2841873d658 01)

Image (98351704 9ff8 4c54 A2c2 E2841873d658 01)
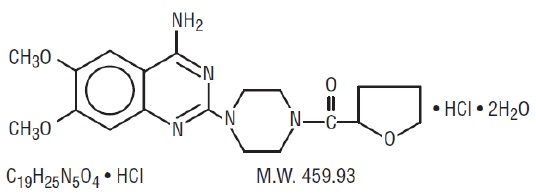
This appears to be a chemical formula written in shorthand notation, including abbreviations for various chemical compounds and molecules. However, it is difficult to determine the exact meaning or context of this notation without additional information or clarity. Therefore, the usefulness of this text is not-available.*
FDA Label Image

Image (98351704 9ff8 4c54 A2c2 E2841873d658 02)

Image (98351704 9ff8 4c54 A2c2 E2841873d658 02)
This is a medical report, probably related to a clinical trial of Terazosin, a medication used to treat hypertension, and urinary symptoms caused by an enlarged prostate. The study evaluated its effect on patients' Symptom Score and Peak Flow Rate. The report shows results of three different studies, each for 24 or 12 weeks, with varying doses of Terazosin, and compared the results to Placebo. From the limited information given, it seems Terazosin has resulted in significant improvement in both Symptom Scores and Peak Flow Rates compared to Placebo, especially at higher doses.*
FDA Label Image

Image (98351704 9ff8 4c54 A2c2 E2841873d658 03)

Image (98351704 9ff8 4c54 A2c2 E2841873d658 03)
This is a figure (Figure 1) from a study, which compares the mean change in total symptom scores and mean increase in peak flow rate (mL/sec) from baseline in two groups - Placebo and Terazosin. The study was conducted over a period of 3 months and the baseline values are provided in the table. The text indicates significant improvement (p < 0.05) in symptom score and peak flow rate for the Terazosin group compared to the placebo group.*
FDA Label Image

Image (98351704 9ff8 4c54 A2c2 E2841873d658 04)

Image (98351704 9ff8 4c54 A2c2 E2841873d658 04)
This is a figure that provides information about the mean change in a total symptom score from baseline in a long-term, open-label, non-placebo controlled study. The study involved 494 participants, and the mean change from baseline was measured at various time intervals, ranging from 0 to 30 months. There is a significant difference (* p<0.05) in the mean change from baseline at some of the time intervals, compared to the baseline of 10.7.*
FDA Label Image

Image (98351704 9ff8 4c54 A2c2 E2841873d658 05)

Image (98351704 9ff8 4c54 A2c2 E2841873d658 05)
The text describes the results of a long-term study (N=494) that evaluated the mean change in peak flow rate from baseline. The data is presented graphically in Figure 3, which shows the mean change in mL/sec over a period of 30 months (from 0 to 30 months). The study was open-label and non-placebo controlled, and the baseline mean was 9.9 mL/sec. The text indicates that there was a statistically significant improvement (p<0.05) in peak flow rate from baseline.*
FDA Label Image

Image (98351704 9ff8 4c54 A2c2 E2841873d658 06)

Image (98351704 9ff8 4c54 A2c2 E2841873d658 06)
This is a chart showing mean changes in blood pressure from baseline to final visit in all double-blind placebo-controlled studies for normotensive and hypertensive patients, categorized by those with DBP less than 90 mmHg and those with DBP greater than 90 mmHg. The study compares results for patients taking placebo versus those taking Terazosin, with statistically significant differences noted between the two groups (p <0.05).*
FDA Label Image

Image (98351704 9ff8 4c54 A2c2 E2841873d658 07)

Image (98351704 9ff8 4c54 A2c2 E2841873d658 07)
The given text describes the adverse reactions during placebo-controlled trials for Benign Prostatic Hyperplasia. It includes a table describing the percentage of patients who experienced different types of adverse reactions after being given placebo or terazosin. The reactions are grouped by body systems including Body as a Whole, Cardiovascular System, Digestive System, Metabolic and Nutritional Disorders, Nervous System, Respiratory System, Special Senses, and Urogenital System. Some of the reactions mentioned are asthenia, flu syndrome, headache, hypotension, palpitations, syncope, nausea, dizziness, somnolence, dyspnea, blurred vision/amblyopia, impotence, and urinary tract infection.*
FDA Label Image

Image (98351704 9ff8 4c54 A2c2 E2841873d658 08)

Image (98351704 9ff8 4c54 A2c2 E2841873d658 08)
This is a table showing the discontinuation rates during placebo-controlled trails for benign prostatic hyperplasia (BPH) in subjects who took either terazosin or placebo. The table shows the percentage of subjects who discontinued the trial due to adverse effects in different body systems such as the cardiovascular system, digestive system, and urogenital system. Some adverse effects included headache, dizziness, and urinary tract infections.*
FDA Label Image

Image (98351704 9ff8 4c54 A2c2 E2841873d658 09)

Image (98351704 9ff8 4c54 A2c2 E2841873d658 09)
The given text provides a Table 3 that showcases the adverse reactions during placebo-controlled trials of terazosin. The table compares the reactions of the body as a whole, cardiovascular system, digestive system, metabolic and nutritional disorders, musculoskeletal system, nervous system, respiratory system, special senses, and urogenital system under terazosin and placebo. The text mentions the percentage difference of each reaction between the two treatments. The reactions that showed a significant difference have been marked with an asterisk symbol in the table.*
FDA Label Image

Image (98351704 9ff8 4c54 A2c2 E2841873d658 10)

Image (98351704 9ff8 4c54 A2c2 E2841873d658 10)
The text describes an excerpt of Table 4 from a clinical trial which compares hypertension drug (Terazosin) with Placebo across different body systems (nervous system, digestive system, cardiovascular system, special senses, metabolic and nutritional disorders, respiratory system). The table displays the percentage of patients that discontinued the treatment during the placebo-controlled trials and the percentage of symptoms specific to each body system.*
FDA Label Image

Image (98351704 9ff8 4c54 A2c2 E2841873d658 11)

FDA Label Image

Image (98351704 9ff8 4c54 A2c2 E2841873d658 12)

FDA Label Image

Tera (Terazosin 60760 0816 90)

Tera (Terazosin 60760 0816 90)
This is a description of a medication called Terazosin that comes in capsules. The capsules are available in 5mg doses and are sold in quantities of 90 capsules. Each capsule is marked with NDC 60760-816-90. The medication is produced by Avei Pharmaceuticals Inc. and packaged by SmPF St. Mary's. The package contains LOT#72222772 and is to be stored at room temperature. No instructions on how to use this medication are available.*

* These product label images have been analyzed using experimental machine learning. Please verify findings with the primary label text.