Paclitaxel Injection, Solution
Product Images NDC 61703-015

View Photos of Packaging, Regulatory Labels, and Product Appearance

Product Visual Gallery

This gallery contains 18 technical images submitted to the FDA as part of the official labeling for Paclitaxel (NDC 61703-015). Unlike standard consumer photos, these assets often include clinical data figures, molecular chemical structures, and official manufacturer packaging layouts.

As provided by Hospira, Inc., these visuals offer a comprehensive scientific overview of the product's physical and chemical identity, aiding pharmacists and researchers in product verification and study.

FDA Label Image

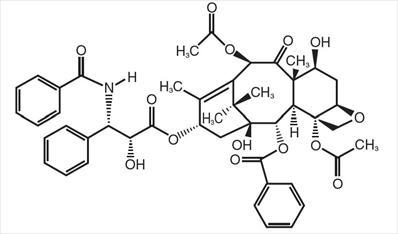
Paclitaxel Structural Formula (Paclitaxel 01)

FDA Label Image

Paclitaxel 01a

Paclitaxel 01a
Chemical structure of paclitaxel showing its complex multi-ring structure, including aromatic phenyl groups and multiple ester and hydroxyl functional groups.*
FDA Label Image

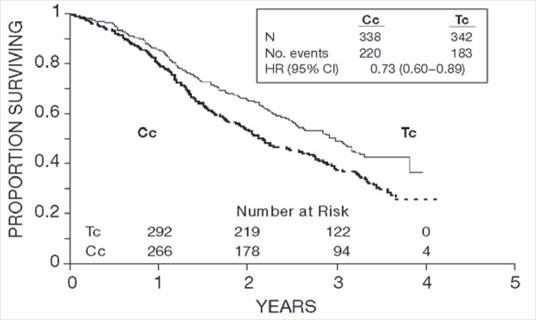
Figure 1. Survival: Cc Versus Tc (intergroup) (Paclitaxel 02)

Figure 1. Survival: Cc Versus Tc (intergroup) (Paclitaxel 02)
A survival curve chart depicting the proportion surviving over time in years, comparing two groups labeled Cc and Tc. The graph includes numbers at risk at yearly intervals and a summary inset with sample sizes, number of events, and hazard ratio (HR) with 95% confidence interval (CI) for the groups.*
FDA Label Image

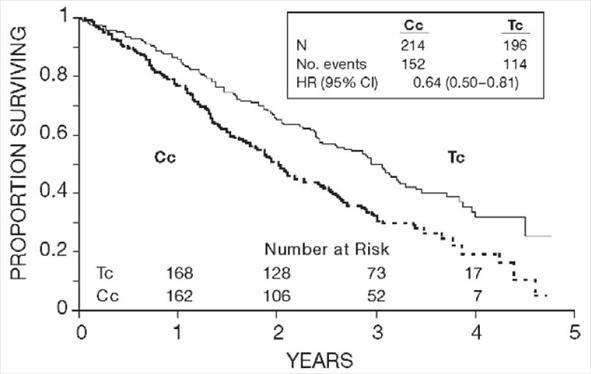
Figure 2. Survival: Cc Versus Tc (gog-111) (Paclitaxel 03)

Figure 2. Survival: Cc Versus Tc (gog-111) (Paclitaxel 03)
A Kaplan-Meier survival curve chart showing the proportion surviving over a 5-year period for two groups labeled Cc and Tc. The vertical axis represents proportion surviving from 0 to 1, and the horizontal axis represents years from 0 to 5. The chart includes a table with sample sizes, number of events, and hazard ratio with 95% confidence interval comparing the two groups.*
FDA Label Image

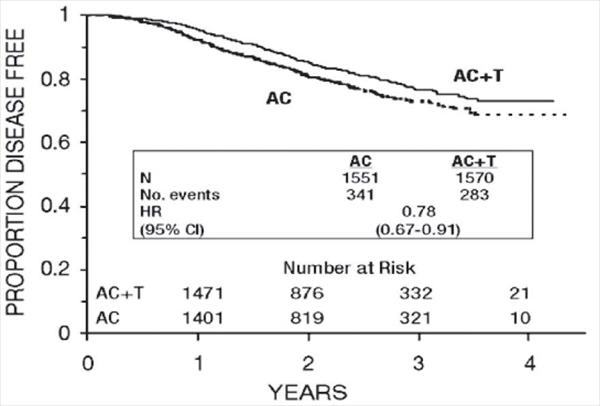
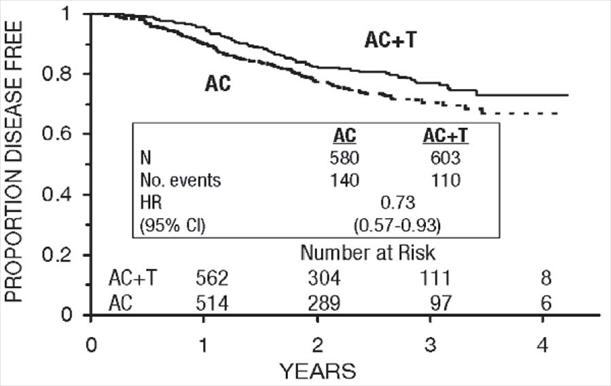
Figure 3. Disease-free Survival: Ac Versus Ac+t (Paclitaxel 04)

Figure 3. Disease-free Survival: Ac Versus Ac+t (Paclitaxel 04)
A Kaplan-Meier survival curve graph showing the proportion of patients disease free over a period of 4 years. Two treatment groups are compared: AC alone and AC plus T, with the AC+T group showing a higher proportion disease free. The graph includes number at risk counts at yearly intervals and a hazard ratio inset with confidence intervals comparing the two groups.*
FDA Label Image

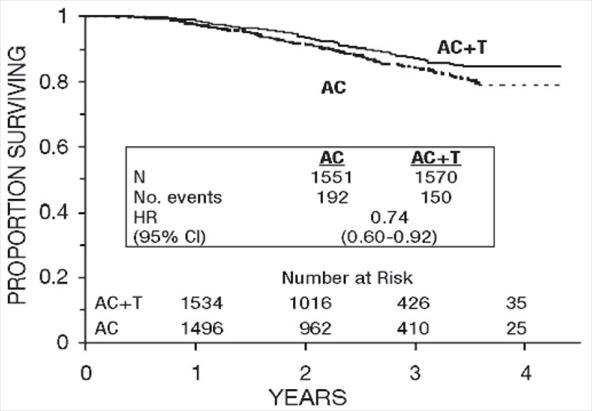
Figure 4. Survival: Ac Versus Ac+t (Paclitaxel 05)

Figure 4. Survival: Ac Versus Ac+t (Paclitaxel 05)
A survival curve chart showing the proportion of patients surviving over a period of 4 years. Two treatment groups are compared: AC and AC+T, with survival proportion on the vertical axis and years on the horizontal axis. A table within the chart provides sample sizes, number of events, and hazard ratio with confidence interval for both groups.*
FDA Label Image

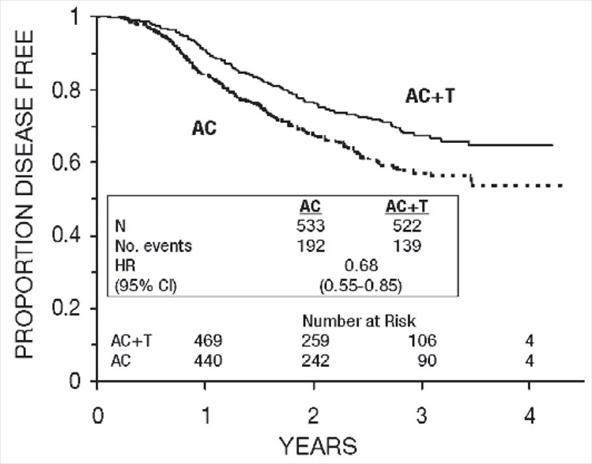
Figure 5. Disease-free Survival: Receptor Status Negative/unknown Ac Versus Ac+t (Paclitaxel 06)

Figure 5. Disease-free Survival: Receptor Status Negative/unknown Ac Versus Ac+t (Paclitaxel 06)
A Kaplan-Meier survival curve graph displaying the proportion of patients disease-free over a period of four years. Two treatment groups are compared: AC alone and AC combined with T (AC+T). The graph includes numbers at risk at various times and hazard ratio data with confidence intervals for disease-free survival outcomes.*
FDA Label Image

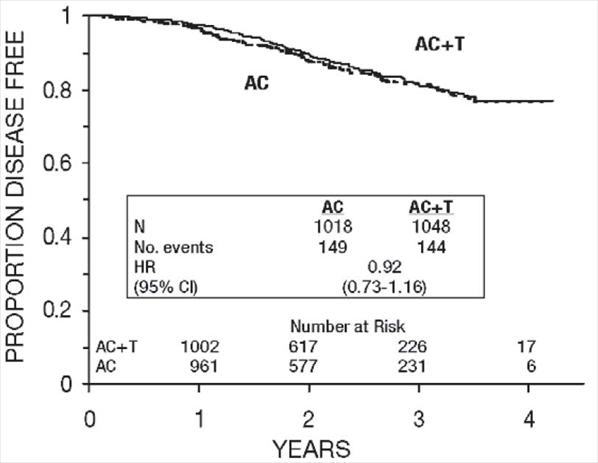
Figure 6. Disease-free Survival: Receptor Status Positive Ac Versus Ac+t (Paclitaxel 07)

Figure 6. Disease-free Survival: Receptor Status Positive Ac Versus Ac+t (Paclitaxel 07)
A Kaplan-Meier survival curve chart depicting the proportion of disease-free patients over a 4-year period for two groups labeled AC and AC+T. The y-axis represents the proportion disease-free (0 to 1), and the x-axis represents time in years (0 to 4). Included is a table showing the number of patients, number of events, hazard ratio (HR), and 95% confidence interval (CI) for each group, along with the number of patients at risk at various time points.*
FDA Label Image

Figure 7. Disease-free Survival: Premonopausal Ac Versus Ac+t (Paclitaxel 08)

Figure 7. Disease-free Survival: Premonopausal Ac Versus Ac+t (Paclitaxel 08)
A Kaplan-Meier survival curve graph showing the proportion of patients disease-free over four years for two treatment groups, AC and AC+T. The graph plots years on the x-axis and proportion disease-free on the y-axis. Data includes number of patients, events, hazard ratio with confidence interval, and number at risk for each group.*
FDA Label Image

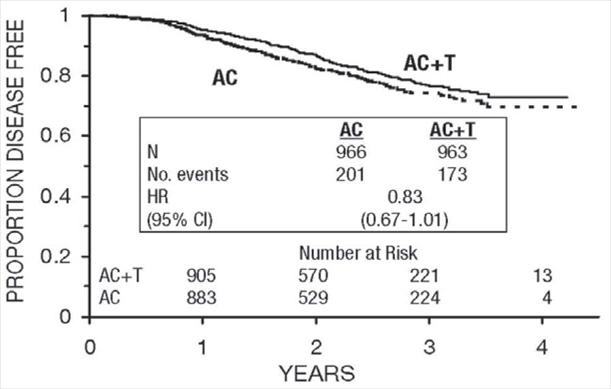
Figure 8. Disease-free Survival: Postmenopausal Ac Versus Ac+t (Paclitaxel 09)

Figure 8. Disease-free Survival: Postmenopausal Ac Versus Ac+t (Paclitaxel 09)
A Kaplan-Meier survival curve showing the proportion of patients disease free over a period of 4 years. Two groups are compared: AC and AC+T. The graph includes a table with sample size, number of events, hazard ratio (HR), and 95% confidence interval (CI) for both groups, as well as numbers at risk at various time points.*
FDA Label Image

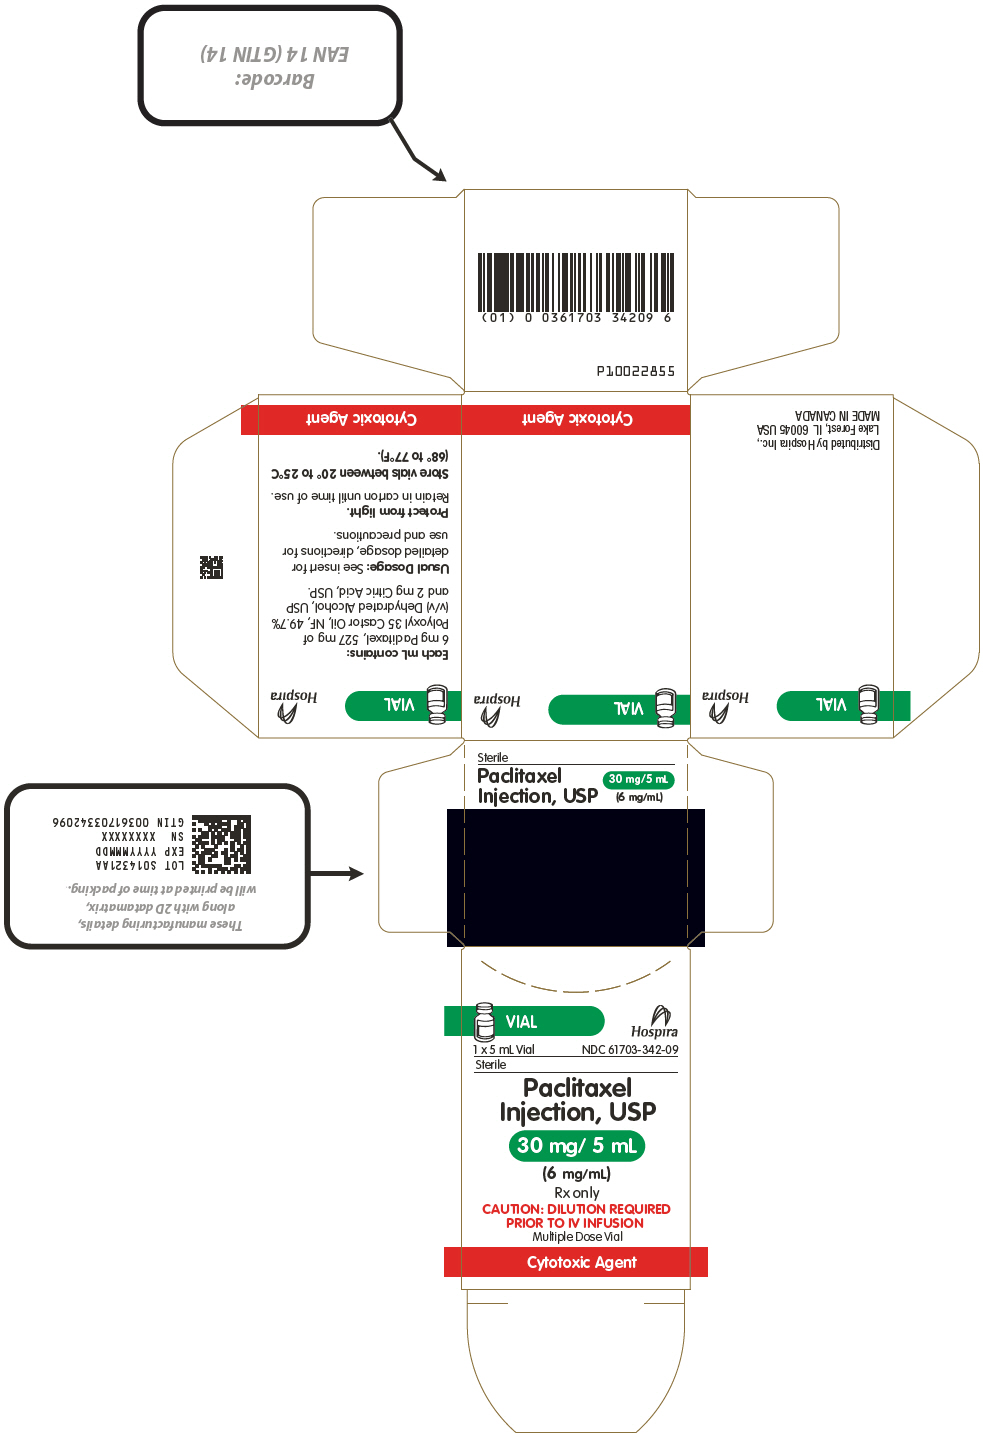
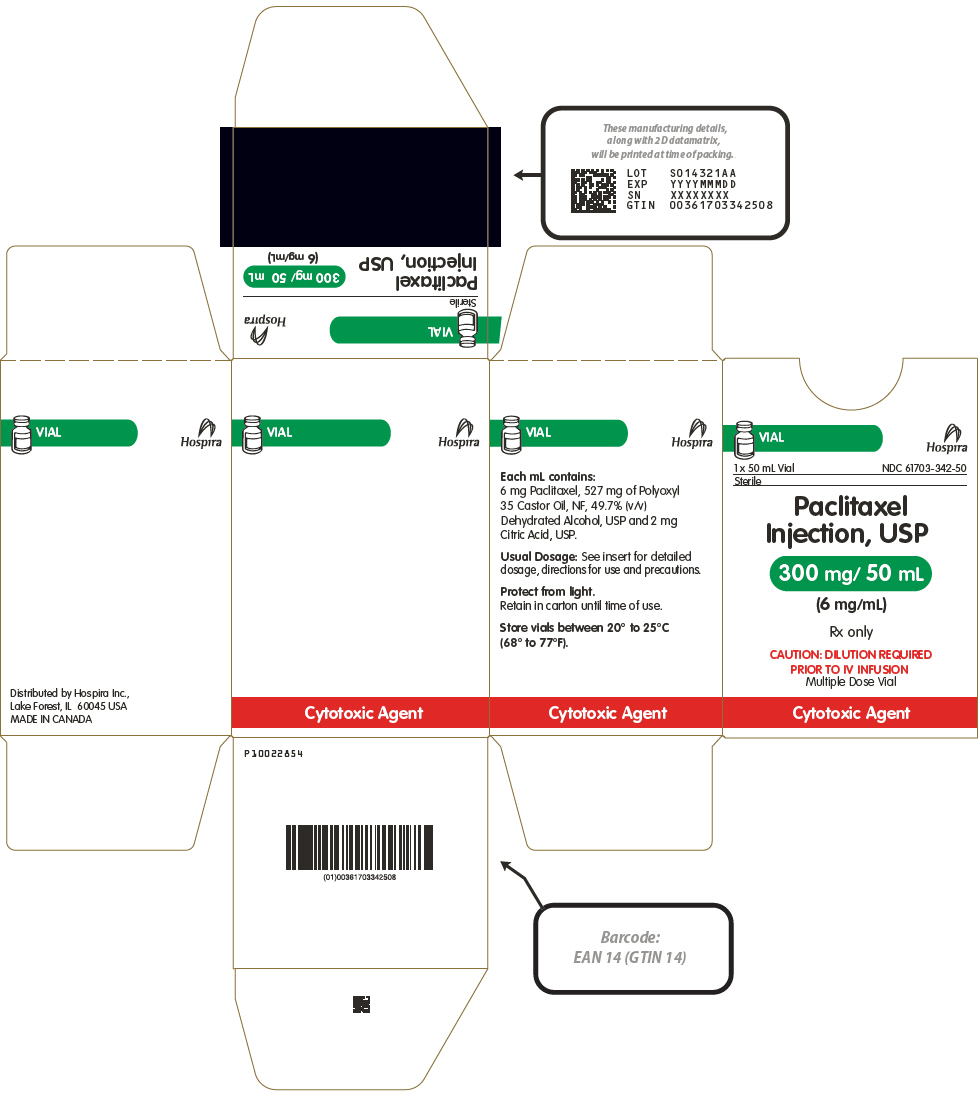
Principal Display Panel (50 mL Vial Label)

FDA Label Image

Principal Display Panel (50 mL Vial Carton)

FDA Label Image

Paclitaxel 12

Paclitaxel 12
Label for Paclitaxel Injection, USP 30 mg/5 mL (6 mg/mL) intravenous injection solution. The 5 mL multiple dose vial is sterile and labeled with warnings including "Dilution Required Prior to IV Infusion" and "Cytotoxic Agent." The product is distributed by Hospira, Inc., Lake Forest, IL, USA.*
FDA Label Image

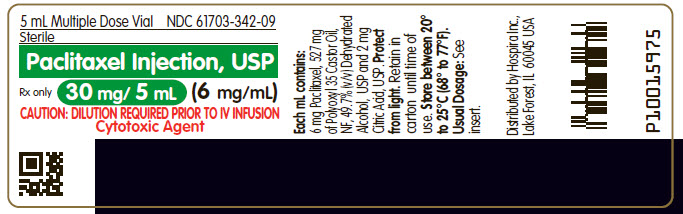
Paclitaxel 13

Paclitaxel 13
Packaging label for Paclitaxel Injection, USP, 30 mg/5 mL (6 mg/mL) sterile intravenous injection by Hospira, Inc. The label includes warnings such as dilution required prior to IV infusion and indicates the vial is a multiple dose. It also marks the product as a cytotoxic agent and shows the NDC number 61703-342-09.*
FDA Label Image

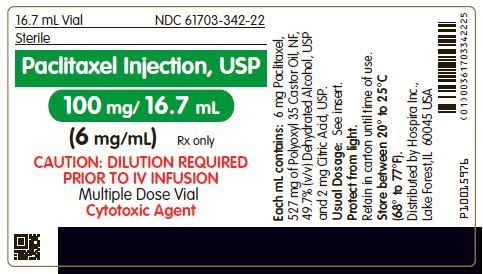
Paclitaxel 14

Paclitaxel 14
Paclitaxel Injection, USP 100 mg per 16.7 mL (6 mg/mL) injection solution vial label from Hospira, Inc. The label states it is a sterile, multiple dose vial requiring dilution prior to intravenous infusion, with a caution for cytotoxic agent handling. The vial volume is 16.7 mL.*
FDA Label Image

Paclitaxel 15

Paclitaxel 15
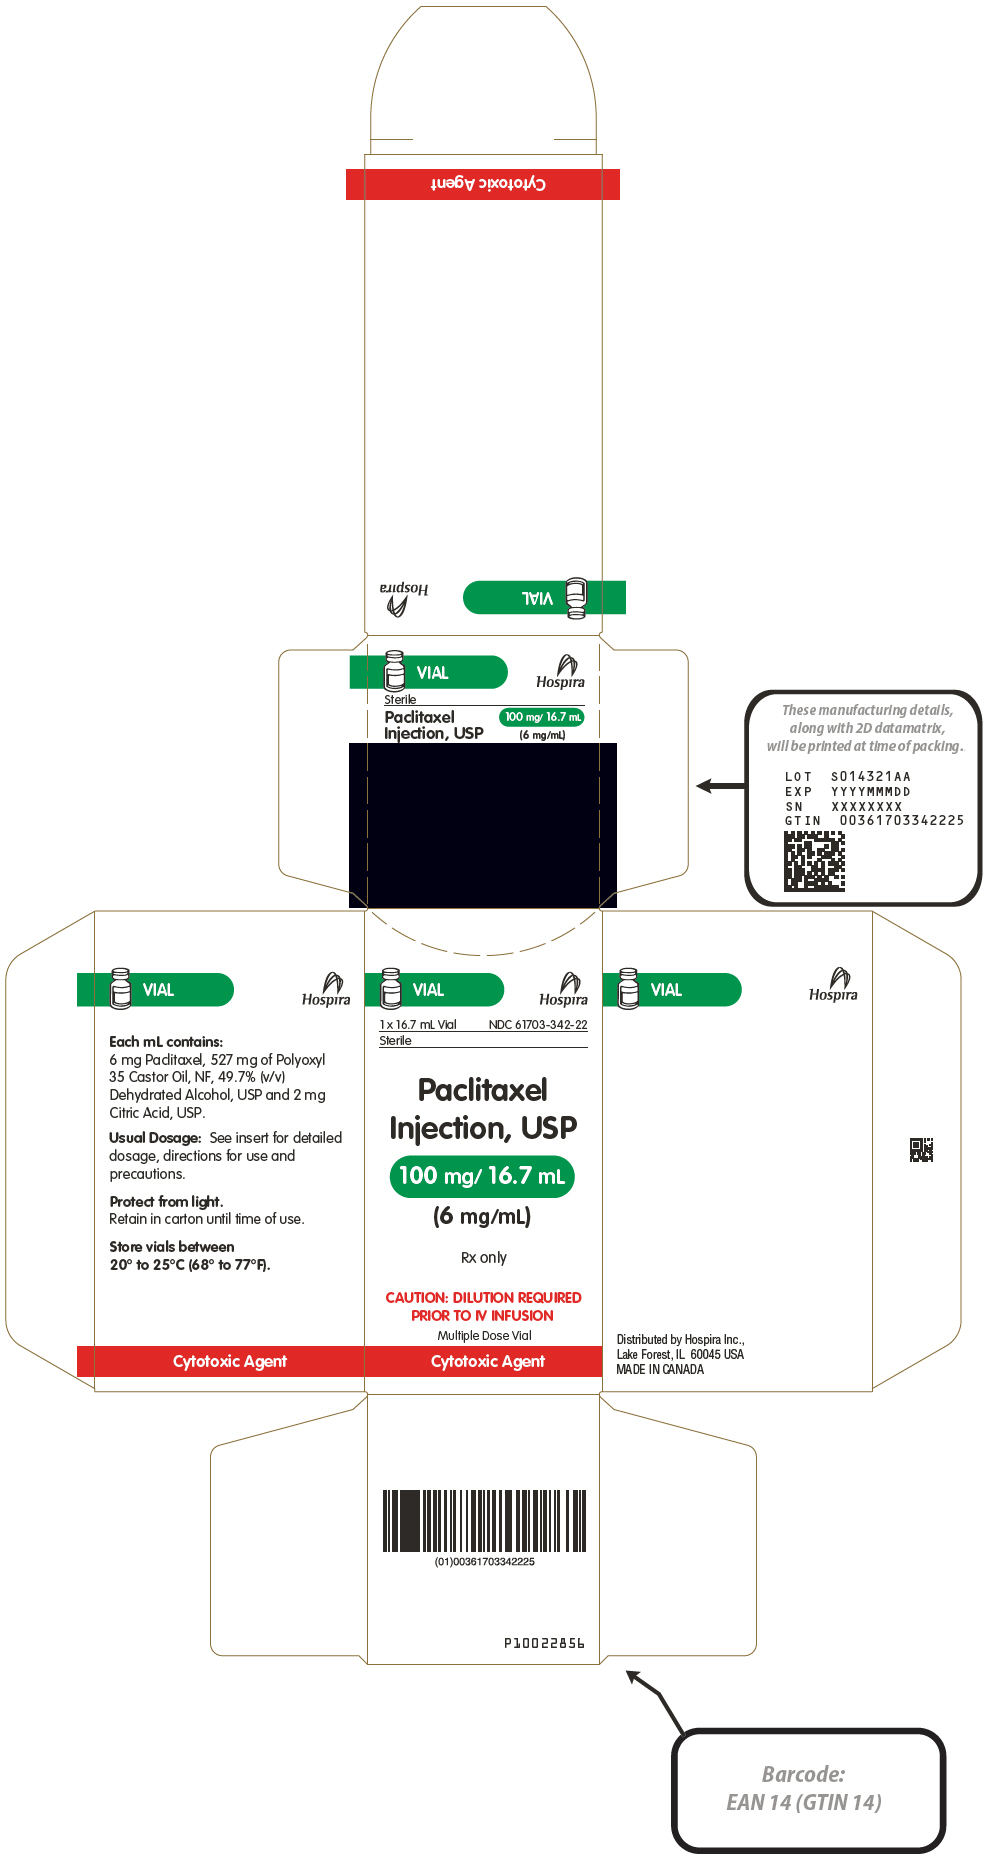
The packaging label for Paclitaxel Injection, USP 100 mg/16.7 mL (6 mg/mL) sterile intravenous solution by Hospira, Inc. The label includes dosage details, storage instructions, a barcode, and warnings such as "Cytotoxic Agent" and dilution required prior to IV infusion. The product is distributed by Hospira, Inc. and made in Canada.*
FDA Label Image

Paclitaxel 16

Paclitaxel 16
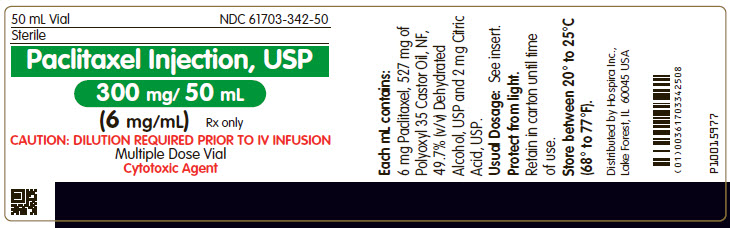
Label for Paclitaxel Injection USP 300 mg/50 mL (6 mg/mL) intravenous injection solution in a 50 mL vial. The label includes a caution that dilution is required prior to IV infusion and states it is a multiple dose vial and cytotoxic agent. The label also lists inactive ingredients and storage instructions. Manufactured by Hospira, Inc.*
FDA Label Image

Paclitaxel 17

Paclitaxel 17
Paclitaxel Injection, USP 300 mg/50 mL (6 mg/mL) vial label from Hospira, Inc. The label includes dosage strength, vial size (50 mL), and administration route (intravenous). It highlights the formulation contains 6 mg Paclitaxel per mL with other ingredients and has warnings such as dilution required prior to IV infusion. The label also identifies the product as a cytotoxic agent and includes manufacturer and storage information.*

* About these descriptions: Image descriptions on this page are generated by automated AI analysis of the product label images from the manufacturer's FDA label submission (SPL). They are provided for reference only and may contain errors or omissions. Always rely on the printed label itself and the official FDA labeling, and consult a pharmacist or healthcare professional with any questions about this product.