Principal Display Panel (350 mg/7 mL Vial Carton)
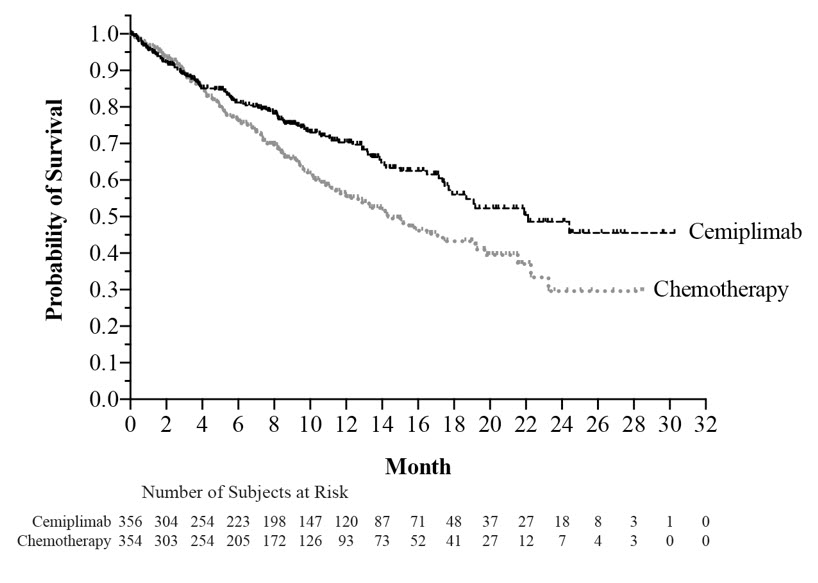
This appears to be a table or chart showing the Probability of Survival for a treatment called "Cemiplimab" compared to "Chemotherapy". The chart shows the number of subjects at risk over the span of 32 months. However, without additional context it is difficult to provide a more specific description or analysis.*