Product Images Omeprazole Dr

View Photos of Packaging, Labels & Appearance

Product Label Images

The following 21 images provide visual information about the product associated with Omeprazole Dr NDC 61919-176 by Direct Rx, such as packaging, labeling, and the appearance of the drug itself. This resource could be helpful for medical professionals, pharmacists, and patients seeking to verify medication information and ensure they have the correct product.

176 - 176 14

176 - 176 14

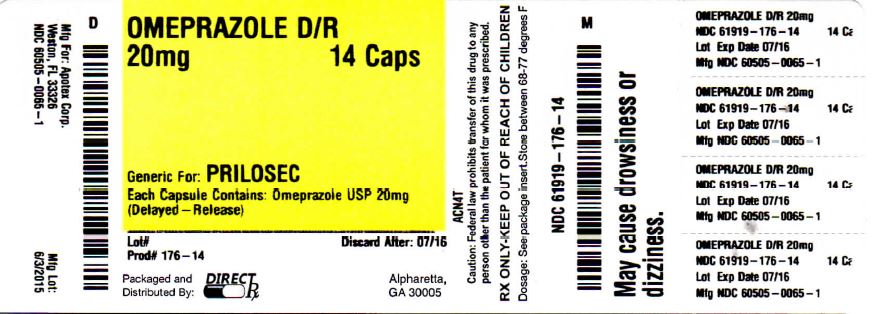
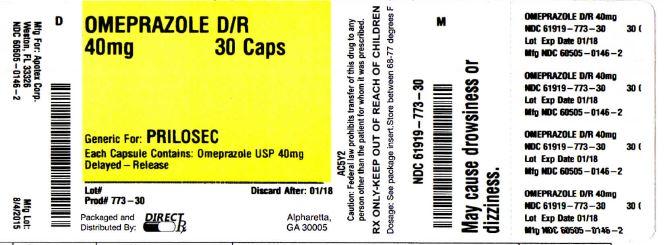
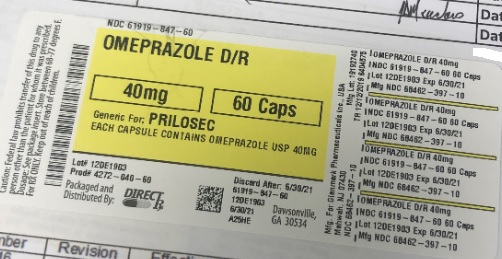
This appears to be a list of medication details for different strengths of Omeprazole, a commonly used proton pump inhibitor used to treat acid reflux and ulcers. The list includes information regarding the product number, lot expiration date, capsule content, packaging information, and other details pertaining to the medication.*

image description - 40mglabel

image description - 40mglabel

61919 847 60

61919 847 60

image description - MOLECULESTRUCTURE

image description - MOLECULESTRUCTURE

image description - TABLE1

image description - TABLE1

The text is describing a table showing the range of mean values obtained from multiple studies regarding the effects of taking either 20mg or 40mg of Omeprazole on the basal acid output, peak acid output, and 24-hour intragastric acidity. The table shows the maximum and minimum values for the percentage decrease in acid output for each parameter with each dosage.*

image description - TABLE10

image description - TABLE10

image description - TABLE12

image description - TABLE12

This is a clinical trial evaluation report about the treatment of gastric ulcer. The report presents the percentage of patients that were healed after treatment with Omeprazole compared to those treated with a Placebo drug. The table shows that 74.8% of patients treated with Omeprazole were healed compared to 48.1% of those treated with the placebo. The sample size was 202 patients, and the treatment was administered once daily at 201 mg. The duration of the study was 8 weeks.*

image description - TABLE13

image description - TABLE13

This is a study on the treatment of gastric ulcer, comparing the effectiveness of Omeprazole (at doses of 20mg and 40mg once daily) and Ranitidine (at 150mg twice daily). The study included 200 patients for Omeprazole 20mg, 187 for Omeprazole 40mg, and 199 for Ranitidine. The percentage of patients healed was measured over a period of weeks. It was found that Omeprazole 40mg was significantly more effective than Ranitidine, and also significantly more effective than Omeprazole 20mg.*

image description - TABLE14

image description - TABLE14

The text shows the results of a study comparing the effectiveness of Omeprazole 20mg and 10mg with a placebo in patients with GERD. A total of 208 patients were included, out of which 115 had confirmed GERD. The study found that Omeprazole 20mg had a significantly higher success rate in resolving heartburn compared to both Omeprazole 10mg and the placebo.*

image description - TABLE15

image description - TABLE15

This text appears to be presenting data from a study that compared the effects of 20mg and 40mg of Omeprazole versus a placebo. The study included a total of 83 participants, with 43 receiving Omeprazole and 40 receiving the placebo. The data shows that there was a significant difference between the effects of Omeprazole and the placebo, with a p-value less than 0.01. Further information about the study and its results is not provided.*

image description - TABLE16

image description - TABLE16

The text describes a life table analysis of a study involving Omeprazole, with 138 participants taking 20mg once daily and 137 taking 20mg three days per week. The study compares the percentage of participants in endoscopic remission at 6 months with a placebo group of 131 participants. The results show that Omeprazole 20mg once daily had a significantly higher rate of remission compared to Omeprazole 20mg three consecutive days per week or placebo.*

image description - TABLE17

image description - TABLE17

This text presents the results of a life table analysis study comparing Omeprazole 20mg once daily, Omeprazole 10mg once daily and Ranitidine 160mg twice daily in a group of 131,133 and 128 patients, respectively. The study observed the percentage of patients in endoscopic remission after 12 months, with the highest percentage achieved by Omeprazole 20mg once daily. Statistical significance was found when comparing Omeprazole 20mg once daily against Omeprazole 10mg once daily or Ranitidine, as well as when comparing Omeprazole 10mg once daily against Ranitidine.*

image description - TABLE2

image description - TABLE2

This text provides a table (Table 2) with tissue concentration measurements for Clarithromycin and Clarithromycin with Omeprazole. The concentrations were measured at two hours after the dose was administered. The tissue types measured were Antrum, Fundus, and Mucus. Antrum tissue had concentrations of 10.48 with Clarithromycin and 19.96 with Clarithromycin and Omeprazole. Fundus tissue had concentrations of 208.14 with Clarithromycin and 242.56 with Clarithromycin and Omeprazole. Mucus tissue had concentration measurements of 4.15 with Clarithromycin and 39.20 with Clarithromycin and Omeprazole.*

image description - TABLE5

image description - TABLE5

image description - TABLE6

image description - TABLE6

The text describes the results of treatment for active duodenal ulcer using Omeprazole and Ranitidine. It shows the percentage of patients healed after taking 20mg of Omeprazole in the morning and 150mg of Ranitidine twice daily for a period of 3 weeks and 8 weeks. There is also a statistical significance indicated by "* p<001".*

image description - TABLE7

image description - TABLE7

The text appears to be a table that shows the percentage of patients healed from active duodenal ulcer after treatment with Omeprazole, Ranitidine, or 150mg twice daily of an unspecified drug. The table displays the percentage of patients healed at Week 2, Week 4, and Week 100. There is also a note at the end of the table marked as * ps001, which could be a reference to a study or a source.*

image description - TABLE8

image description - TABLE8

Table 5 shows the per-protocol and intent-to-treat A pylori eradication rates in percentage, as well as the confidence interval for patients cured. It compares the efficacy of Omeprazole + Clarithromycin + Amoxicillin versus Clarithromycin + Amoxicillin. Three different studies are presented, each with different sample sizes, and the results vary between 20% to 78% eradication rates.*

image description - TABLE9

image description - TABLE9

This is a table showing the H. pylori eradication rates achieved with different interventions at 4 to 6 weeks. The table shows the percentage of patients successfully treated, as well as the confidence intervals. The interventions tested were Omeprazole + Clarithromycin, Omeprazole monotherapy, and Clarithromycin monotherapy. The studies were conducted in both the United States and non-US locations. Some results were considered statistically significantly higher than others.*

image description - pediatrics

image description - pediatrics

This is a medical chart that indicates the daily recommended dose of Omeprazole based on the weight of the patient. For patients weighing between 10-20 kg, a daily dose of 10mg is recommended, while for those weighing above 20kg up to 220kg, a daily dose of 20mg is advised.*

image description - table3

image description - table3

This is a table presenting pharmacokinetic parameters of Omeprazole in different populations - children weighing less than 20kg, children weighing more than 20kg, and adults - following single and repeated oral administration. The table includes data on concentration (Coa and Crnt), area under curve (AuC and ALC) and the number of individuals (n) for each parameter. The note indicates that data is from single and repeated dose studies.*

image description - table4

image description - table4

This appears to be a table showing the results of a study on the effectiveness of clarithromycin in treating H. pylori bacteria. The table shows the pre and post-treatment clarithromycin susceptibility test results for patients undergoing dual and triple therapies. It also shows the rates of eradication for H. pylori bacteria based on the susceptibility test results. The table also includes information on MIC values, which help determine the sensitivity of the bacteria to the antibiotic.*

* The product label images have been analyzed using a combination of traditional computing and machine learning techniques. It should be noted that the descriptions provided may not be entirely accurate as they are experimental in nature. Use the information in this page at your own discretion and risk.