Image Description (Figure01)
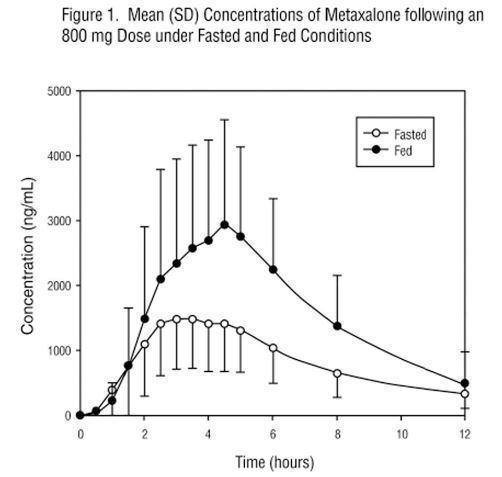
This is a figure showing the mean concentration of Metaxalone in ng/mL over time (in hours) after the administration of an 800mg dose under fasted and fed conditions. The x-axis shows the time elapsed, while the y-axis shows Metaxalone concentration in ng/mL. The graph indicates that the maximum concentration of Metaxalone is achieved within the first two to three hours, and it is higher under fed conditions than fasted conditions. The standard deviation is also shown in the graph.*