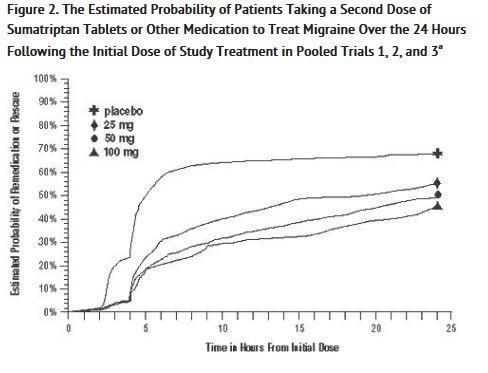
Image Description (Figure01)

This is a graph that shows the estimated probability of achieving initial headache response within 4 hours of treatment in pooled trials 1, 2, and 3. The X-axis represents time in minutes from initial dose, while the Y-axis represents the estimated probability of achieving response. The graph indicates that the probability of achieving initial headache response within 4 hours of treatment is 100% at the time of initial dose and decreases over time.*