Letairis Tablet, Film Coated
Product Images NDC 61958-0801

12 FDA label images from Gilead Sciences, Inc. · Packaging, Regulatory Labels, and Product Appearance

Product Visual Gallery

This gallery contains 12 technical images submitted to the FDA as part of the official labeling for Letairis (NDC 61958-0801). Unlike standard consumer photos, these assets often include clinical data figures, molecular chemical structures, and official manufacturer packaging layouts.

As provided by Gilead Sciences, Inc., these visuals offer a comprehensive scientific overview of the product's physical and chemical identity, aiding pharmacists and researchers in product verification and study.

FDA Label Image

Chemical Structure (Letairis 01)

Chemical Structure (Letairis 01)
Chemical structure diagram of AMBRISENTAN, the active ingredient in Letairis, showing its molecular framework including aromatic rings and functional groups.*
FDA Label Image

Figure 2 (Letairis 02)

Figure 2 (Letairis 02)
A chart depicting pharmacokinetic interactions of ambrisentan with various drugs. It shows fold changes and 90% confidence intervals for Cmax and AUC values relative to ambrisentan alone, along with dosing recommendations. Most drugs require no dose adjustment except cyclosporine, where ambrisentan is limited to 5 mg once daily.*
FDA Label Image

Figure 3 (Letairis 03)

Figure 3 (Letairis 03)
A forest plot chart showing pharmacokinetic fold changes and 90% confidence intervals for various interacting drugs when combined with Letairis (ambrisentan). The x-axis represents change relative to the interacting drug alone. Data for Cmax and AUC are shown for drugs including Cyclosporine, Digoxin, Ethinylestradiol, Norethindrone, Mycophenolic acid, Ritonavir, Sildenafil and its metabolite Desmethylsildenafil, Tadalafil, and Warfarin with its isomers. Recommendations indicate no dose adjustment needed for all listed drugs.*
FDA Label Image

Figure 4 (Letairis 04)

Figure 4 (Letairis 04)
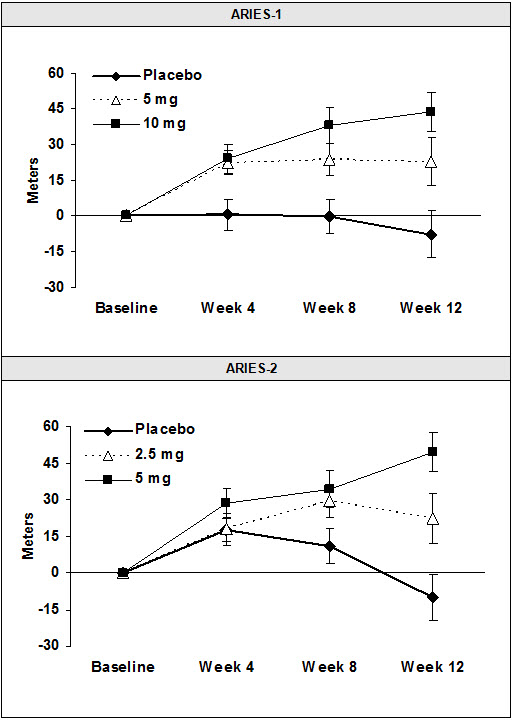
Two line graphs titled ARIES-1 and ARIES-2 displaying changes in meters over time from Baseline to Week 12. They compare Placebo and different doses of a drug, with markers showing means and error bars for variability. ARIES-1 shows doses of 5 mg and 10 mg; ARIES-2 shows doses of 2.5 mg and 5 mg, plotting distance in meters on the vertical axis and weeks on the horizontal axis.*
FDA Label Image

Figure 5 (Letairis 05)

Figure 5 (Letairis 05)
Two Kaplan-Meier event-free survival curves from ARIES-1 and ARIES-2 studies comparing Letairis (ambrisentan) and placebo over 12 weeks. Both charts plot event-free percentage versus time in weeks, showing higher event-free percentages for Letairis (97% and 94%) compared to placebo (89% and 79%) with corresponding p-values (0.030 and 0.005). Number at risk data for Letairis and placebo are included below each graph.*
FDA Label Image

Figure 6 (Letairis 06)

Figure 6 (Letairis 06)
Two Kaplan-Meier event-free survival curves comparing event-free percentages over time in weeks. The top graph compares Letairis monotherapy (blue dashed line) with combination therapy (black solid line). The bottom graph compares Tadalafil monotherapy (red dashed line) with combination therapy (black solid line). Both graphs include hazard ratios, confidence intervals, and p-values, with numbers at risk listed below each x-axis.*
FDA Label Image

Figure 7 (Letairis 07)

Figure 7 (Letairis 07)
A forest plot chart showing hazard ratios (HR) with 95% confidence intervals (CI) for various clinical events comparing combination therapy versus monotherapy with Letairis (ambrisentan) or tadalafil. Events include primary endpoints, death, hospitalization for worsening PAH, short-term clinical worsening, and inadequate long-term clinical response. The plot visually indicates favorability of combination therapy or monotherapy across these outcomes, using square and triangle markers to differentiate comparisons.*
FDA Label Image

Figure 8 (Letairis 08)

Figure 8 (Letairis 08)
A hazard ratio forest plot showing comparison of combination therapy versus Letairis (ambrisentan) monotherapy and tadalafil monotherapy across various patient subgroups. The chart includes event counts and 95% confidence intervals, with favoring direction indicated. Subgroups cover overall, sex, age, geographic region, WHO functional class, disease type, and walking distance categories.*
FDA Label Image

Figure 9 (Letairis 09)

Figure 9 (Letairis 09)
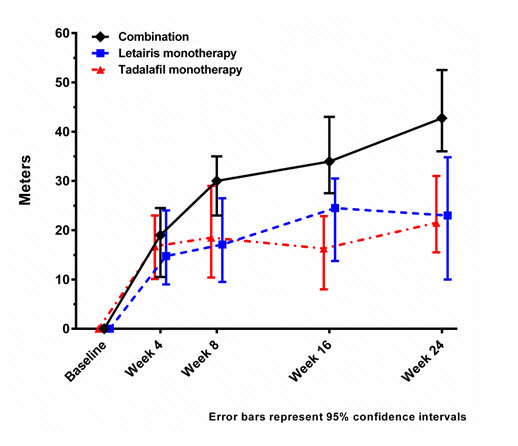
A line graph comparing the distance in meters over time (Baseline, Week 4, Week 8, Week 16, Week 24) for three treatment groups: Combination therapy, Letairis monotherapy, and Tadalafil monotherapy. The graph includes error bars representing 95% confidence intervals, with distance increasing over time for all groups, most prominently in the combination group.*
FDA Label Image

Chart (Letairis 10)

Chart (Letairis 10)
An instructional diagram presenting four contraceptive method options labeled Option 1 through Option 4. Each option outlines combinations of contraceptive methods including intrauterine devices, sterilization, hormonal contraceptives (oral and patch), vaginal ring, injections, male condoms, diaphragms with spermicide, cervical caps with spermicide, and vasectomy. The methods are grouped under headings indicating use of either one or combinations of methods.*
FDA Label Image

Principal Display Panel (5 mg Tablet Carton)

Principal Display Panel (5 mg Tablet Carton)
Packaging label for Letairis (ambrisentan) Tablets, 5 mg by Gilead Sciences, Inc. The label indicates film-coated oral tablets, with a package size of 10 tablets. The label includes dosing strength, manufacturer information, and dispensing instructions.*
FDA Label Image

Principal Display Panel (10 mg Tablet Carton)

Principal Display Panel (10 mg Tablet Carton)
Packaging label for Letairis (ambrisentan) tablets, 10 mg, film-coated oral tablets by Gilead Sciences, Inc. The carton indicates it contains 10 tablets, with a prescription-only designation. The label includes manufacturer details and instructions for authorized dispensers to provide a medication guide with the carton.*

* About these descriptions: Image descriptions on this page are generated by automated AI analysis of the product label images from the manufacturer's FDA label submission (SPL). They are provided for reference only and may contain errors or omissions. Always rely on the printed label itself and the official FDA labeling, and consult a pharmacist or healthcare professional with any questions about this product.