Dutasteride
Product Images NDC 62112-8068

9 FDA label images from Intergel Pharmaceuticals Inc · Packaging, Regulatory Labels, and Product Appearance

Product Visual Gallery

This gallery contains 9 technical images submitted to the FDA as part of the official labeling for Dutasteride (NDC 62112-8068). Unlike standard consumer photos, these assets often include clinical data figures, molecular chemical structures, and official manufacturer packaging layouts.

As provided by Intergel Pharmaceuticals Inc, these visuals offer a comprehensive scientific overview of the product's physical and chemical identity, aiding pharmacists and researchers in product verification and study.

FDA Label Image

Figure 1. Aua-si Score* Change From Baseline (randomized, Double-blind, Placebo-controlled Studies Pooled) (7065c13c 25db 4b15 80d6 5fbb30dfeb0f 02)
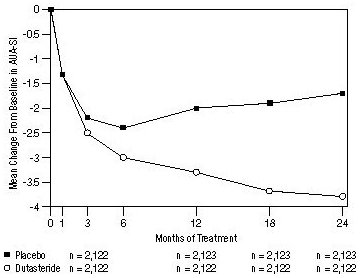
Figure 1. Aua-si Score* Change From Baseline (randomized, Double-blind, Placebo-controlled Studies Pooled) (7065c13c 25db 4b15 80d6 5fbb30dfeb0f 02)
A line graph depicting mean change from baseline in an unspecified measure over 24 months of treatment, comparing Dutasteride and placebo groups. The x-axis represents months of treatment (0 to 24), and the y-axis shows mean change, with data points plotted for both groups. Dutasteride shows a greater decline over time compared to placebo.*
FDA Label Image

Figure 2. Percent Of Subjects Developing Acute Urinary Retention Over A 24-month Period (randomized, Double-blind, Placebo-controlled Studies Pooled) (7065c13c 25db 4b15 80d6 5fbb30dfeb0f 03)

Figure 2. Percent Of Subjects Developing Acute Urinary Retention Over A 24-month Period (randomized, Double-blind, Placebo-controlled Studies Pooled) (7065c13c 25db 4b15 80d6 5fbb30dfeb0f 03)
A cumulative incidence line graph depicting percent of patients over 24 months of treatment for Dutasteride versus placebo groups. The x-axis shows months of treatment from 0 to 24, and the y-axis shows percent of patients from 0 to 6. Data tables below the graph provide cumulative event numbers and patients at risk for each group over time.*
FDA Label Image

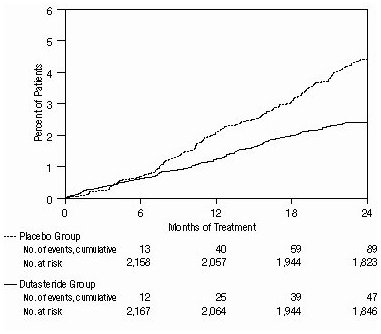
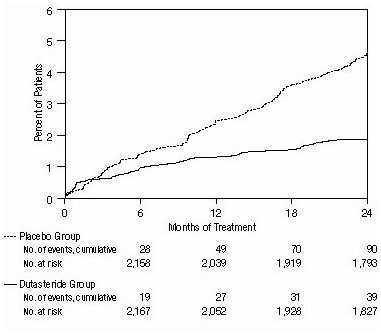
Figure 3. Percent Of Subjects Having Surgery For Benign Prostatic Hyperplasia Over A 24-month Period (randomized, Double-blind, Placebo-controlled Studies Pooled) (7065c13c 25db 4b15 80d6 5fbb30dfeb0f 04)

Figure 3. Percent Of Subjects Having Surgery For Benign Prostatic Hyperplasia Over A 24-month Period (randomized, Double-blind, Placebo-controlled Studies Pooled) (7065c13c 25db 4b15 80d6 5fbb30dfeb0f 04)
A cumulative event percent vs. months of treatment line graph comparing Placebo Group and Dutasteride Group over 24 months. The x-axis represents months of treatment up to 24, and the y-axis shows percent of patients up to 6%. The graph includes numerical data tables for number of events and number at risk at intervals 0, 6, 12, 18, and 24 months for both groups.*
FDA Label Image

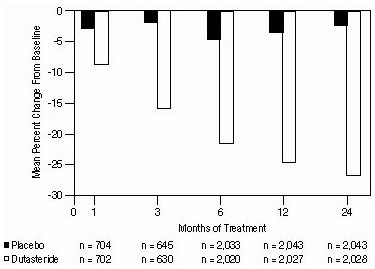
Figure 4. Prostate Volume Percent Change From Baseline (randomized, Double-blind, Placebo-controlled Studies Pooled) (7065c13c 25db 4b15 80d6 5fbb30dfeb0f 05)

Figure 4. Prostate Volume Percent Change From Baseline (randomized, Double-blind, Placebo-controlled Studies Pooled) (7065c13c 25db 4b15 80d6 5fbb30dfeb0f 05)
A bar graph comparing mean percent change from baseline over months of treatment between Placebo and Dutasteride groups. The X-axis shows treatment duration in months (0, 1, 3, 6, 12, 24). The Y-axis represents mean percent change from baseline ranging from 0 to -30%. The data includes the number of subjects per group at each time point.*
FDA Label Image

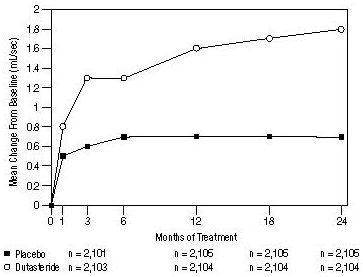
Figure 5. Qmax Change From Baseline (randomized, Double-blind, Placebo-controlled Studies Pooled) (7065c13c 25db 4b15 80d6 5fbb30dfeb0f 06)

Figure 5. Qmax Change From Baseline (randomized, Double-blind, Placebo-controlled Studies Pooled) (7065c13c 25db 4b15 80d6 5fbb30dfeb0f 06)
A line graph comparing the mean change from baseline (in mL/sec) over months of treatment between a placebo group and a dutasteride-treated group. The dutasteride group shows a steady increase in flow rate over 24 months, whereas the placebo group levels off early with minimal change.*
FDA Label Image

Figure 6. International Prostate Symptom Score Change From Baseline Over A 48-month Period (randomized, Double-blind, Parallel Group Trial [combat Trial]) (7065c13c 25db 4b15 80d6 5fbb30dfeb0f 07)

Figure 6. International Prostate Symptom Score Change From Baseline Over A 48-month Period (randomized, Double-blind, Parallel Group Trial [combat Trial]) (7065c13c 25db 4b15 80d6 5fbb30dfeb0f 07)
A line graph showing the mean change from baseline in IPSS (International Prostate Symptom Score) over 48 months of treatment. Three groups are compared: Dutasteride plus tamsulosin, Dutasteride 0.5 mg, and Tamsulosin 0.4 mg. Data points are plotted with three distinct line symbols, with the Dutasteride plus tamsulosin group consistently showing the greatest reduction over time.*
FDA Label Image

Figure 7. Qmax Change Ffrom Baseline Over A 24-month Period (randomized, Double-blind, Parallel Group Study [combat Study]) (7065c13c 25db 4b15 80d6 5fbb30dfeb0f 08)

Figure 7. Qmax Change Ffrom Baseline Over A 24-month Period (randomized, Double-blind, Parallel Group Study [combat Study]) (7065c13c 25db 4b15 80d6 5fbb30dfeb0f 08)
A line graph depicting mean change from baseline in mL/sec over 24 months of treatment for Dutasteride with tamsulosin, Dutasteride 0.5 mg, and Tamsulosin 0.4 mg. The x-axis shows months of treatment from 0 to 24, and the y-axis shows mean change from baseline values from 0 to 3. Sample sizes at various time points are noted for each treatment group.*
FDA Label Image

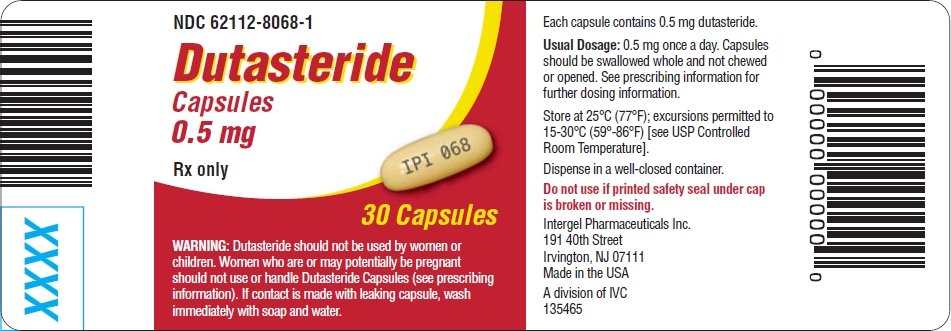
Dutasteride Capsules 0.5 mg Bottle Label (30 Count) (Dutasteride Capsules Bottle 30count)

Dutasteride Capsules 0.5 mg Bottle Label (30 Count) (Dutasteride Capsules Bottle 30count)
Dutasteride 0.5 mg capsules label from Intergel Pharmaceuticals Inc, NDC 62112-8068. The label shows a capsule marked 'IPI 068' and indicates a quantity of 30 capsules. It includes dosage instructions, storage conditions, warnings, and manufacturer details. The label also features two barcodes.*
FDA Label Image

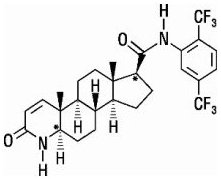
Dutasteride Structural Formula (Image 01)

Dutasteride Structural Formula (Image 01)
Chemical structure of Dutasteride, depicting the steroid backbone with attached trifluoromethyl-substituted aromatic ring and amide functional groups.*

* About these descriptions: Image descriptions on this page are generated by automated AI analysis of the product label images from the manufacturer's FDA label submission (SPL). They are provided for reference only and may contain errors or omissions. Always rely on the printed label itself and the official FDA labeling, and consult a pharmacist or healthcare professional with any questions about this product.