Acarbose Tablet
Product Images NDC 62135-455

View Photos of Packaging, Regulatory Labels, and Product Appearance

Product Visual Gallery

This gallery contains 6 technical images submitted to the FDA as part of the official labeling for Acarbose (NDC 62135-455). Unlike standard consumer photos, these assets often include clinical data figures, molecular chemical structures, and official manufacturer packaging layouts.

As provided by Chartwell Rx, Llc, these visuals offer a comprehensive scientific overview of the product's physical and chemical identity, aiding pharmacists and researchers in product verification and study.

FDA Label Image

Image Description (Acarbose Tablets Usp 100mg Label)
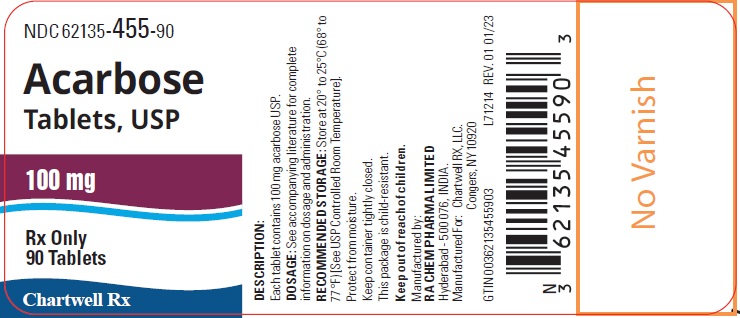
Image Description (Acarbose Tablets Usp 100mg Label)
Acarbose Tablets USP 100 mg oral tablets packaging label shows 90 tablets per bottle. The label includes the proprietary name Acarbose, strength 100 mg, and the labeler Chartwell RX, LLC. It states prescription use only and includes storage recommendations and barcode information.*
FDA Label Image

Image Description (Acarbose Tablets Usp 25mg Label)

Image Description (Acarbose Tablets Usp 25mg Label)
Acarbose 25 mg Tablets, USP label for oral use. The carton indicates the package contains 90 tablets. The label also shows Chartwell Rx as the labeler and includes storage instructions and barcode information. It specifies 'Rx Only' and has a section marked 'No Varnish'.*
FDA Label Image

Image Description (Acarbose Tablets Usp 50mg Label)

Image Description (Acarbose Tablets Usp 50mg Label)
The label for Acarbose Tablets, USP, 50 mg strength, by Chartwell RX, LLC. It indicates the package contains 90 tablets for oral use, with a Rx only designation. The label includes storage instructions, barcode, NDC 62135-454-90, and a note stating "No Varnish."*
FDA Label Image

Image Description (Acarbose Tablets Usp Figure 1)

Image Description (Acarbose Tablets Usp Figure 1)
A bar chart titled 'Dose of Acarbose tablets (t.i.d)' showing mean change in plasma glucose (mg/dL) on the vertical axis for doses of 25 mg, 50 mg, 100 mg, 200 mg, and 300 mg of acarbose. Each bar is labeled with the respective sample size (N) and indicates greater reduction in plasma glucose at higher doses, with the 300 mg dose showing the largest decrease.*
FDA Label Image

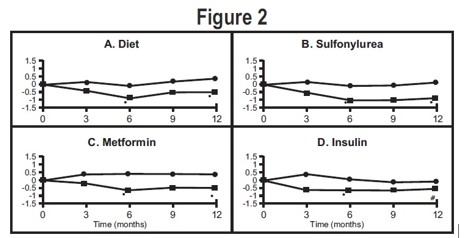
Image Description (Acarbose Tablets Usp Figure 2)

Image Description (Acarbose Tablets Usp Figure 2)
Figure 2 presents four line graphs comparing variables over a 12-month period. The panels are labeled A. Diet, B. Sulfonylurea, C. Metformin, and D. Insulin, each showing trends of measurements from baseline to 12 months on the x-axis and values ranging approximately from -1.5 to 1.5 on the y-axis. The graphs illustrate different response patterns over time for each treatment or condition group.*
FDA Label Image

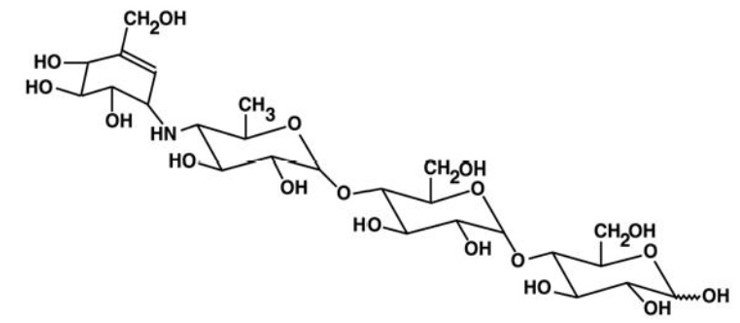
Image Description (Acarbose Tablets Usp Structure)

Image Description (Acarbose Tablets Usp Structure)
Chemical structure of acarbose, showing its molecular composition with multiple hydroxyl groups and sugar moieties connected by glycosidic bonds.*

* About these descriptions: Image descriptions on this page are generated by automated AI analysis of the product label images from the manufacturer's FDA label submission (SPL). They are provided for reference only and may contain errors or omissions. Always rely on the printed label itself and the official FDA labeling, and consult a pharmacist or healthcare professional with any questions about this product.