Levetiracetam Solution
Product Images NDC 62135-548

11 FDA label images from Chartwell Rx, Llc · Packaging, Regulatory Labels, and Product Appearance

Product Visual Gallery

This gallery contains 11 technical images submitted to the FDA as part of the official labeling for Levetiracetam Solution (NDC 62135-548). Unlike standard consumer photos, these assets often include clinical data figures, molecular chemical structures, and official manufacturer packaging layouts.

As provided by Chartwell Rx, Llc, these visuals offer a comprehensive scientific overview of the product's physical and chemical identity, aiding pharmacists and researchers in product verification and study.

FDA Label Image

"image Description" (Levetiracetam Os For 1)

"image Description" (Levetiracetam Os For 1)
A text panel showing the formula for calculating the daily dose of Levetiracetam oral solution. It displays: Daily dose (mg/kg/day) multiplied by patient weight (kg), divided by the concentration 100 mg/mL to determine the total daily dose in mL/day.*

FDA Label Image

"image Description" (Levetiracetam Os For 2)

"image Description" (Levetiracetam Os For 2)
The image shows a pharmacokinetic formula for calculating creatinine clearance (CLcr) based on age in years, weight in kilograms, serum creatinine in mg/dL, and a correction factor for female patients (0.85). This mathematical expression is commonly used to estimate kidney function.*
FDA Label Image

"image Description" (Levetiracetam Os For 3)

"image Description" (Levetiracetam Os For 3)
Mathematical formula depicting the calculation for creatinine clearance (CLcr) normalized by body surface area, shown as CLcr (mL/min/1.73m²) equals (CLcr in mL/min) divided by subject's body surface area (BSA in m²) multiplied by 1.73.*
FDA Label Image

"image Description" (Levetiracetam Os Structure)

"image Description" (Levetiracetam Os Structure)
Chemical structure diagram of LEVETIRACETAM, illustrating its molecular components and bonds, corresponding to the active ingredient in LEVETIRACETAM solution 100 mg/mL.*
FDA Label Image

"image Description" (Levetiracetam Os Fig 1)

"image Description" (Levetiracetam Os Fig 1)
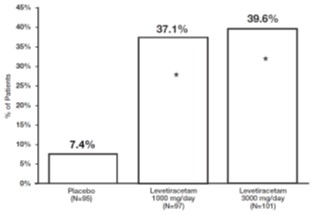
A bar graph depicting the percentage of patients across three groups: Placebo with 7.4%, Levetiracetam 1000 mg/day with 37.1%, and Levetiracetam 3000 mg/day with 39.6%. Each bar is labeled with the respective percentage and sample size, illustrating comparative effects of different dosages of Levetiracetam solution versus placebo.*
FDA Label Image

"image Description" (Levetiracetam Os Fig 2)

"image Description" (Levetiracetam Os Fig 2)
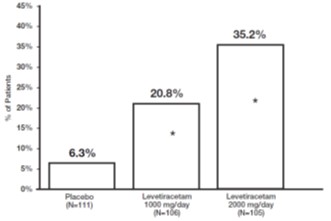
Bar graph showing the percentage of patients in three groups: Placebo, Levetiracetam 100 mg/day, and Levetiracetam 200 mg/day. The graph depicts an increasing trend in patient response with higher doses of Levetiracetam compared to placebo.*
FDA Label Image

"image Description" (Levetiracetam Os Fig 3)

"image Description" (Levetiracetam Os Fig 3)
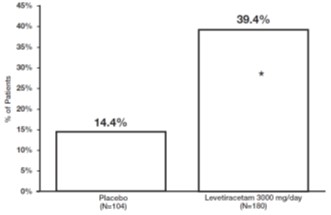
A bar chart comparing the percentage of patients between two groups: Placebo (N=104) at 14.4% and Levetiracetam 3000 mg/day (N=180) at 39.4%. The y-axis shows the percentage of patients from 0% to 45%, highlighting a higher response in the Levetiracetam group.*
FDA Label Image

"image Description" (Levetiracetam Os Fig 4)

"image Description" (Levetiracetam Os Fig 4)
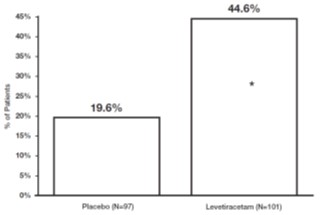
A bar chart showing the percentage of patients in two groups: Placebo (N=97) with 19.6% and Levetiracetam (N=101) with 44.6%. The y-axis represents the percentage of patients, ranging from 0% to 45%.*
FDA Label Image

"image Description" (Levetiracetam Os Fig 5)

"image Description" (Levetiracetam Os Fig 5)
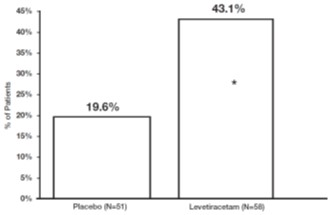
A bar chart comparing the percentage of patients between placebo and levetiracetam groups. The placebo group shows 19.6% of patients (N=51), while the levetiracetam group shows 43.1% of patients (N=58). An asterisk marks the levetiracetam bar, likely indicating statistical significance.*
FDA Label Image

"image Description" (Levetiracetam Os Fig 6)

"image Description" (Levetiracetam Os Fig 6)
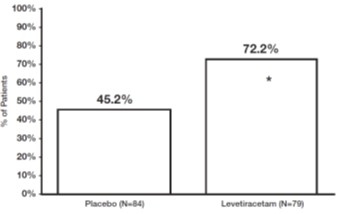
A bar chart comparing the percentage of patients between two groups: Placebo (N=84) and Levetiracetam (N=79). The chart shows higher patient percentage for Levetiracetam at 72.2% compared to Placebo at 45.2%, indicating a comparative result between these two treatments.*
FDA Label Image

"image Description" (Levetiracetam Os 100mg Bottle Label)

"image Description" (Levetiracetam Os 100mg Bottle Label)
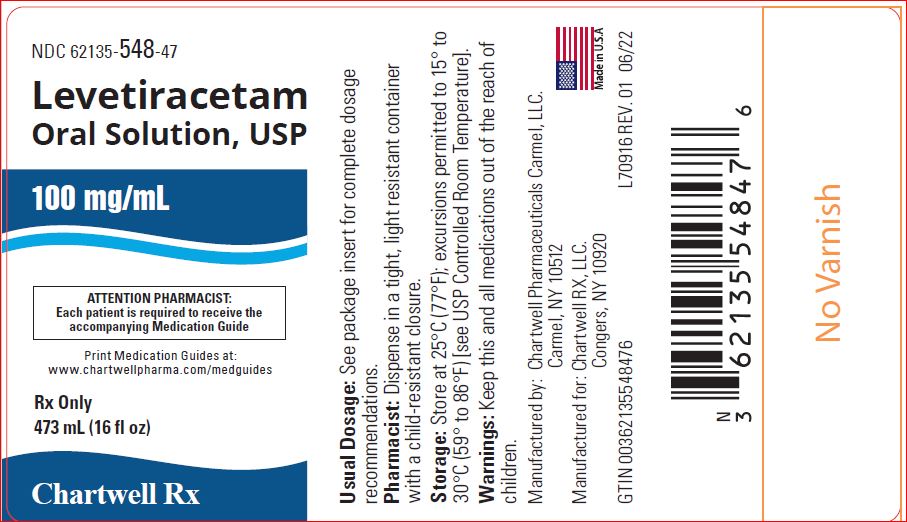
Levetiracetam Oral Solution USP 100 mg/mL label for a 473 mL (16 fl oz) bottle. The label indicates it is an oral solution manufactured by Chartwell Pharmaceuticals Carmel LLC and labeled by Chartwell RX, LLC. It includes storage instructions, pharmacist cautions, a barcode, and notes that the product is Rx only.*

* About these descriptions: Image descriptions on this page are generated by automated AI analysis of the product label images from the manufacturer's FDA label submission (SPL). They are provided for reference only and may contain errors or omissions. Always rely on the printed label itself and the official FDA labeling, and consult a pharmacist or healthcare professional with any questions about this product.