Montelukast Sodium Tablet, Chewable
Product Images NDC 62135-781

View Photos of Packaging, Regulatory Labels, and Product Appearance

Product Visual Gallery

This gallery contains 5 technical images submitted to the FDA as part of the official labeling for Montelukast Sodium (NDC 62135-781). Unlike standard consumer photos, these assets often include clinical data figures, molecular chemical structures, and official manufacturer packaging layouts.

As provided by Chartwell Rx, Llc, these visuals offer a comprehensive scientific overview of the product's physical and chemical identity, aiding pharmacists and researchers in product verification and study.

FDA Label Image

Image Description (Montelukast Sodium Tab 4mg 30s Bot)
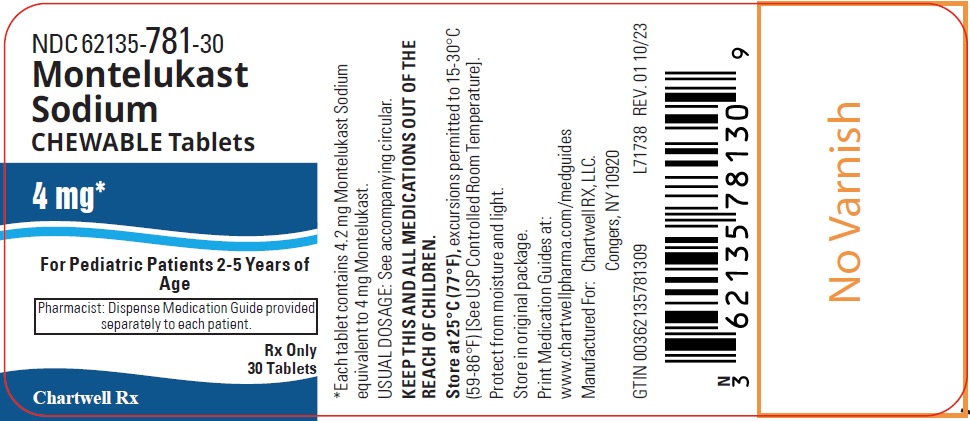
Image Description (Montelukast Sodium Tab 4mg 30s Bot)
Label for Montelukast Sodium 4 mg chewable tablets for pediatric patients aged 2-5 years. The label includes dosage strength, quantity of 30 tablets, and indicates Chartwell RX, LLC as the manufacturer. It also features usage instructions and storage conditions, along with a barcode.*
FDA Label Image

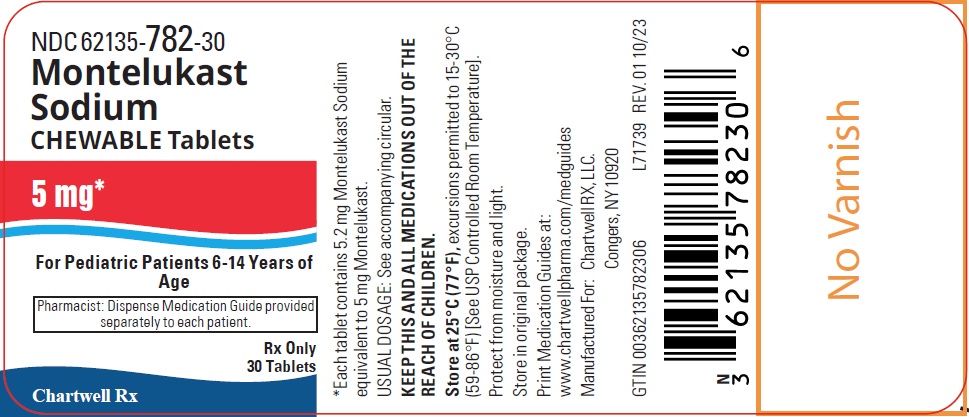
Image Description (Montelukast Sodium Tab 5mg 30s Bot)

Image Description (Montelukast Sodium Tab 5mg 30s Bot)
Montelukast Sodium 5 mg chewable tablets label for pediatric patients 6-14 years of age. The package contains 30 tablets. Labeler is Chartwell RX, LLC. The label includes storage instructions and a note for pharmacists to dispense the medication guide separately. Barcode and NDC 62135-782-30 are visible.*
FDA Label Image

Image Description (Montelukast Sodium Tab Fig 1)

Image Description (Montelukast Sodium Tab Fig 1)
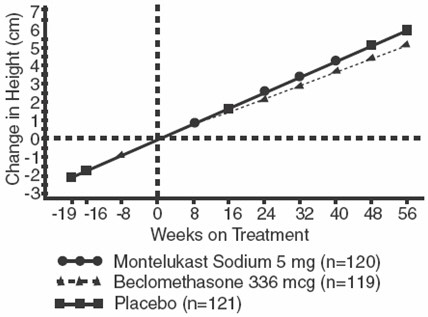
A line graph depicting change in height (cm) over weeks on treatment for three groups: Montelukast Sodium 5 mg, Beclomethasone 336 mcg, and Placebo. The x-axis shows weeks on treatment from -19 to 56, and the y-axis shows change in height from -3 to 7 cm. Each treatment group is represented by a different line style and marker.*
FDA Label Image

Image Description (Montelukast Sodium Tab Fig 2)

Image Description (Montelukast Sodium Tab Fig 2)
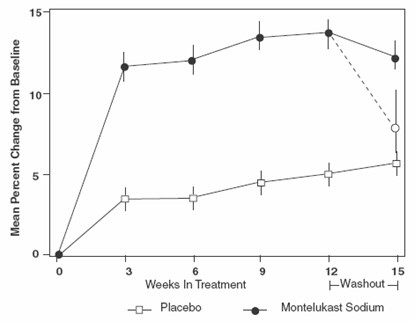
A line graph displaying the mean percent change from baseline over weeks in treatment for Montelukast Sodium compared to placebo. The x-axis shows weeks in treatment up to 15 weeks, including a washout period after week 12. The y-axis represents mean percent change from baseline. Montelukast Sodium shows a greater increase over time compared to placebo.*
FDA Label Image

Image Description (Montelukast Sodium Tab Structure)

Image Description (Montelukast Sodium Tab Structure)
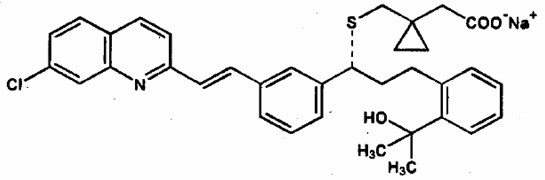
Chemical structure diagram of montelukast sodium, illustrating its molecular framework including aromatic rings, a cyclopropane moiety, and a sodium carboxylate group.*

* About these descriptions: Image descriptions on this page are generated by automated AI analysis of the product label images from the manufacturer's FDA label submission (SPL). They are provided for reference only and may contain errors or omissions. Always rely on the printed label itself and the official FDA labeling, and consult a pharmacist or healthcare professional with any questions about this product.