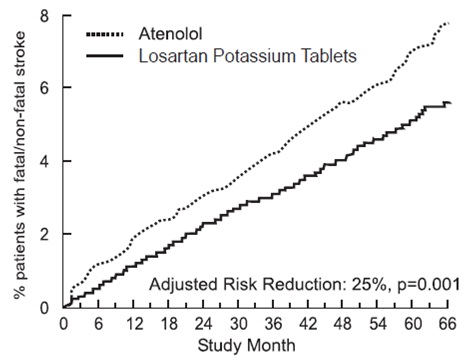
Figure 1 (Losartan Fig1)

This appears to be a chart or graph presenting data from a clinical study involving Atenolol and Losartan Potassium Tablets used to treat patients with an unspecified condition. The chart shows the study month on the X-axis and the percentage of patients with a primary endpoint on the Y-axis. An adjusted risk reduction of 13% is mentioned with a p-value of .021. Further information on the study is not available.*